Chapter 16: Statistics and Data Plots 271
16STATS.DOC TI-89/TI-92 Plus: Statistics and Data Plots (English) Susan Gullord Revised: 02/23/01 1:12 PM Printed: 02/23/01 2:17 PM Page 271 of 22
Suppose you enter the test scores from a class that has 10th and 11th
grade students. You want to analyze the scores for the whole class,
but you also want to analyze categories such as 10th grade girls, 10th
grade boys, 10th grade girls and boys, etc.
First, determine the category values you want to use.
Category Value Used to indicate:
1 10th grade girl
2 10th grade boy
3 11th grade girl
4 11th grade boy
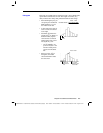
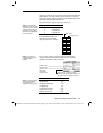
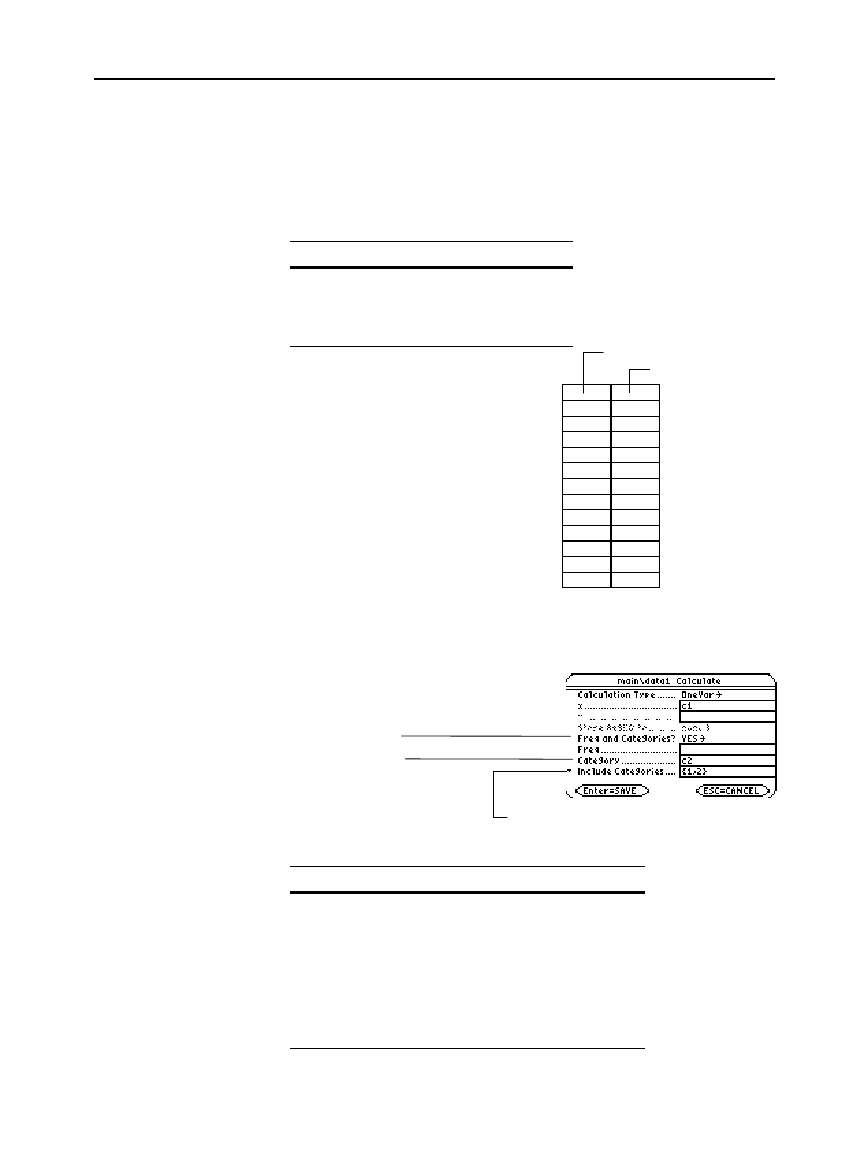
In the Data/Matrix Editor, you
can enter the scores and the
category values in two columns.
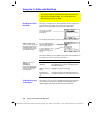
To use category values, specify the category column and the
category values to include in the analysis when you perform a
statistical calculation or define a stat plot.
To analyze: Include Categories:
10th grade girls {1}
10th grade boys {2}
10th grade girls and boys {1,2}
11th grade girls {3}
11th grade boys {4}
11th grade girls and boys {3,4}
all girls (10th and 11th) {1,3}
all boys (10th and 11th) {2,4}
Note: You do not need a
category value for the whole
class. Also, you do not need
category values for all 10th
graders or all 11th graders
since they are combinations
of other categories.
Note: You can also use
category values from a list
variable instead of a
column.
Note: To analyze the whole
class, leave the Category
input box blank. Any
category values are ignored.
c1 c2
85 1
97 3
92 2
88 3
90 2
95 1
79 4
68 2
92 4
84 3
82 1
Test scores
Category values
Set this to YES.
Type the column
number (or list
name) that
contains the
category values.
Within braces { }, type the category
values to use, separated by commas. (Do
not type a column number or list name.)


