


Reference
Specifications (Pass/Fail Limits)
Chapter 5
125
Reference
7. AMPS SAT Frequency Error
Enter the upper and lower limits, in Hz.
The Test Software measures the difference between the measured SAT frequency and
the SAT frequency specified in the Base Station Configuration Menu, and compares
the result with the limits.
When testing all SAT frequencies, the Test Software changes the SAT frequency to
measure each frequency in sequence, using the same frequency error limits for all
measurements.
8. AMPS SAT Peak Deviation
Enter the upper and lower limits, in Hz.
The Test Software measures the peak deviation for the SAT with all other modulation
turned off, and compares the result with the limits.
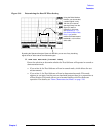
9. Output Power Adjustment Error
Enter the upper and lower limits, in dB.
These limits determine how the power meter will be displayed. When the power
meter display is displayed, it includes major tick marks that indicate the adjustment
range for power settings. If you enter ±1 dB as the limits, the meter will be drawn
with the ideal setting in the center and major tick marks 1-dB up and 1-dB down
from center.
10.Output Power Error
Enter the upper and lower limits, in dB.
While the previous limits (Output Power Adjustment Error) controlled the
adjustment diagram in power meter use, the Output Power Error limits determine
whether the power measurement made in automated testing meets specifications. If
you set Output Power Error limits of ±2 dB, these limits will be used when a power
measurement is made. If the power measured is more than 2 dB from the desired
setting, a fail indication (F) will result.
NOTE In general, it is best to set the Output Power Adjustment Error limits set narrower
(smaller) than the Output Power Error limits.