


Voice Testing with the FrameScope Pro 3
Interpreting Results
Agilent FrameScope Pro User’s Manual 91
Interpreting Results
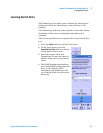
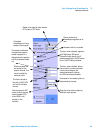
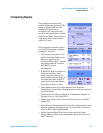
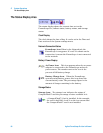
The statistics measured are
plotted in graphical format. The
graph is plotted offline with
timing info displayed as
iterations (the interval is 500
ms) in X-axis and R-Factor, MOS,
Packet Loss Ratio, Packet Round
Trip delay, Inter Arrival Jitter
values in Y-axis.
Each iterations shown is based
on the RTCP message exchange
during the VoIP test.
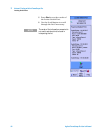
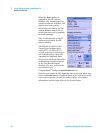
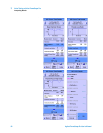
• The Inter-arrival jitter, Total
Packet Loss and Packet Loss
Ratio are based on the
received RTP packets. Round
trip delay is based on other
part RTCP packet
information,
• R-FACTOR, MOS are based on
Inter-arrival jitter, total
packet loss and packet loss
ratio and Round trip delay, if
the other part has no RTCP
packet sent, then the Round
Trip Delay will set to zero.
• Total Packets Sent are counts packets sent from the
FrameScope Pro which is displaying the results and not from
the other party.
• Total Packet Lost. This is based on "Cumulative Number of
Packets Lost" in RFC1889/3550.
• Packet Loss Ratio. This is based on "Fraction Lost" in RFC
1889/3550
• Total Packets DiscardedTotal Packets Discarded refers to the
number of packet dropped at the receiving side if there are
erros in RTP header information,
• Packet Discard Ratio.This refers to the interval Packet
Discard Ratio, which is the discarded packet ratio for each
RTCP interval.