


5-18
User Guide for Internetwork Performance Monitor
OL-11291-01
Chapter 5 Working With IPM From the CiscoWorks Homepage
Viewing Latency Data
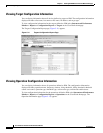
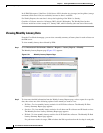
Viewing Daily Latency Data
You can view a daily summary of latency data for each collector on the IPM server.
To view daily latency data collected by IPM:
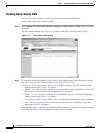
Step 1 Select Internetwork Performance Monitor > Reports > Latency Reports > Daily on the CiscoWorks
homepage.
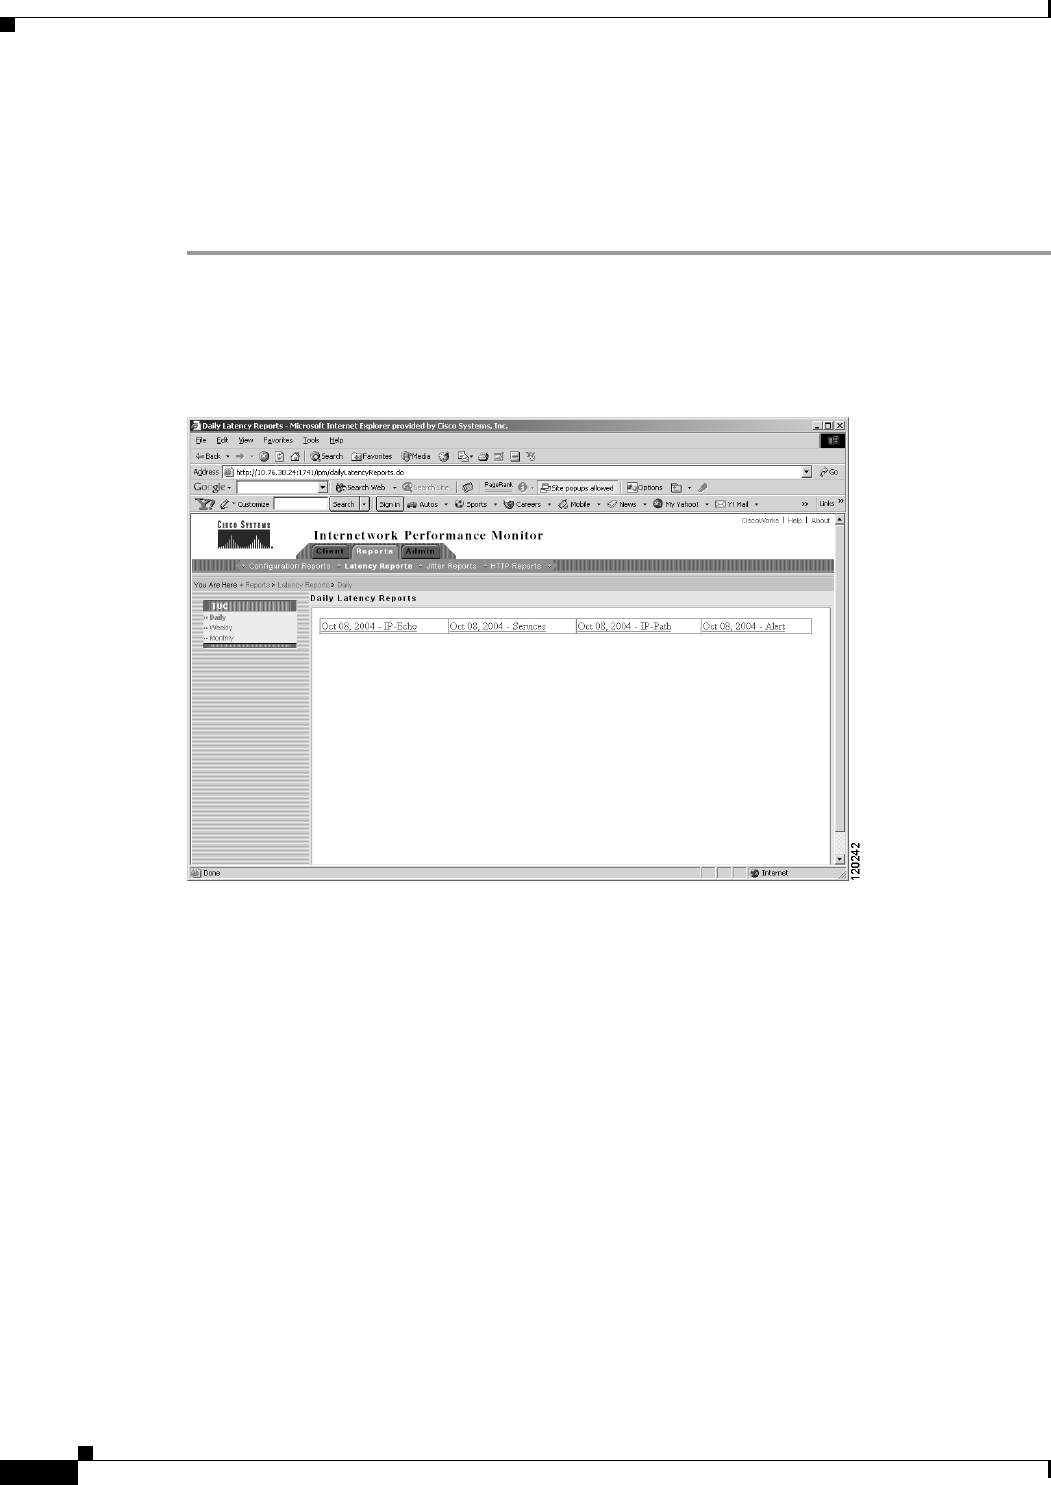
The Daily Latency Reports page (Figure 5-15) appears, with reports sorted by average latency.
Figure 5-15 Daily Latency Reports Page
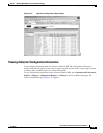
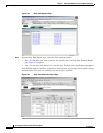
Step 2
To view more detailed information from the Daily Latency Reports page, select a report for a specific
date, then select one of the following options for the date you want to view:
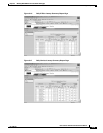
• IP-Echo—To view daily latency statistics for all IP Echo collectors. The Daily IP-Echo Latency
Summary Report page (Figure 5-16) appears.
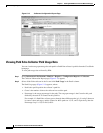
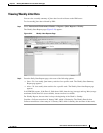
• Services—To view daily latency statistics for all other non-IP collectors and IP-based services. The
Daily Services Latency Summary Report page (Figure 5-17) appears.
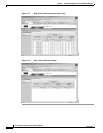
• IP-Path—To view daily latency statistics for all IP Path Echo collectors. The Daily IP-Path Latency
Summary Report page (Figure 5-18) appears.
If a path never reaches its target, IPM calculates the Web report based on the last hop in each path.
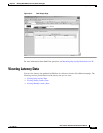
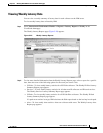
• Alert—To view daily alert statistics. Alerts are collectors with errors. The Daily Latency Alert
Report page (Figure 5-19) appears.
In all IPM Web reports, if the Error % field shows 100%, then the Avg (average) and Avg Max (average
maximum) fields show N/A (not available), because no data is available.