


2-18
User Guide for Internetwork Performance Monitor
OL-11291-01
Chapter 2 Getting Started With IPM
Viewing Network Performance Statistics
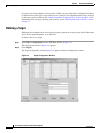
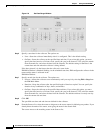
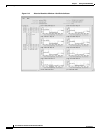
Viewing Network Performance Statistics in Real Time
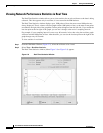
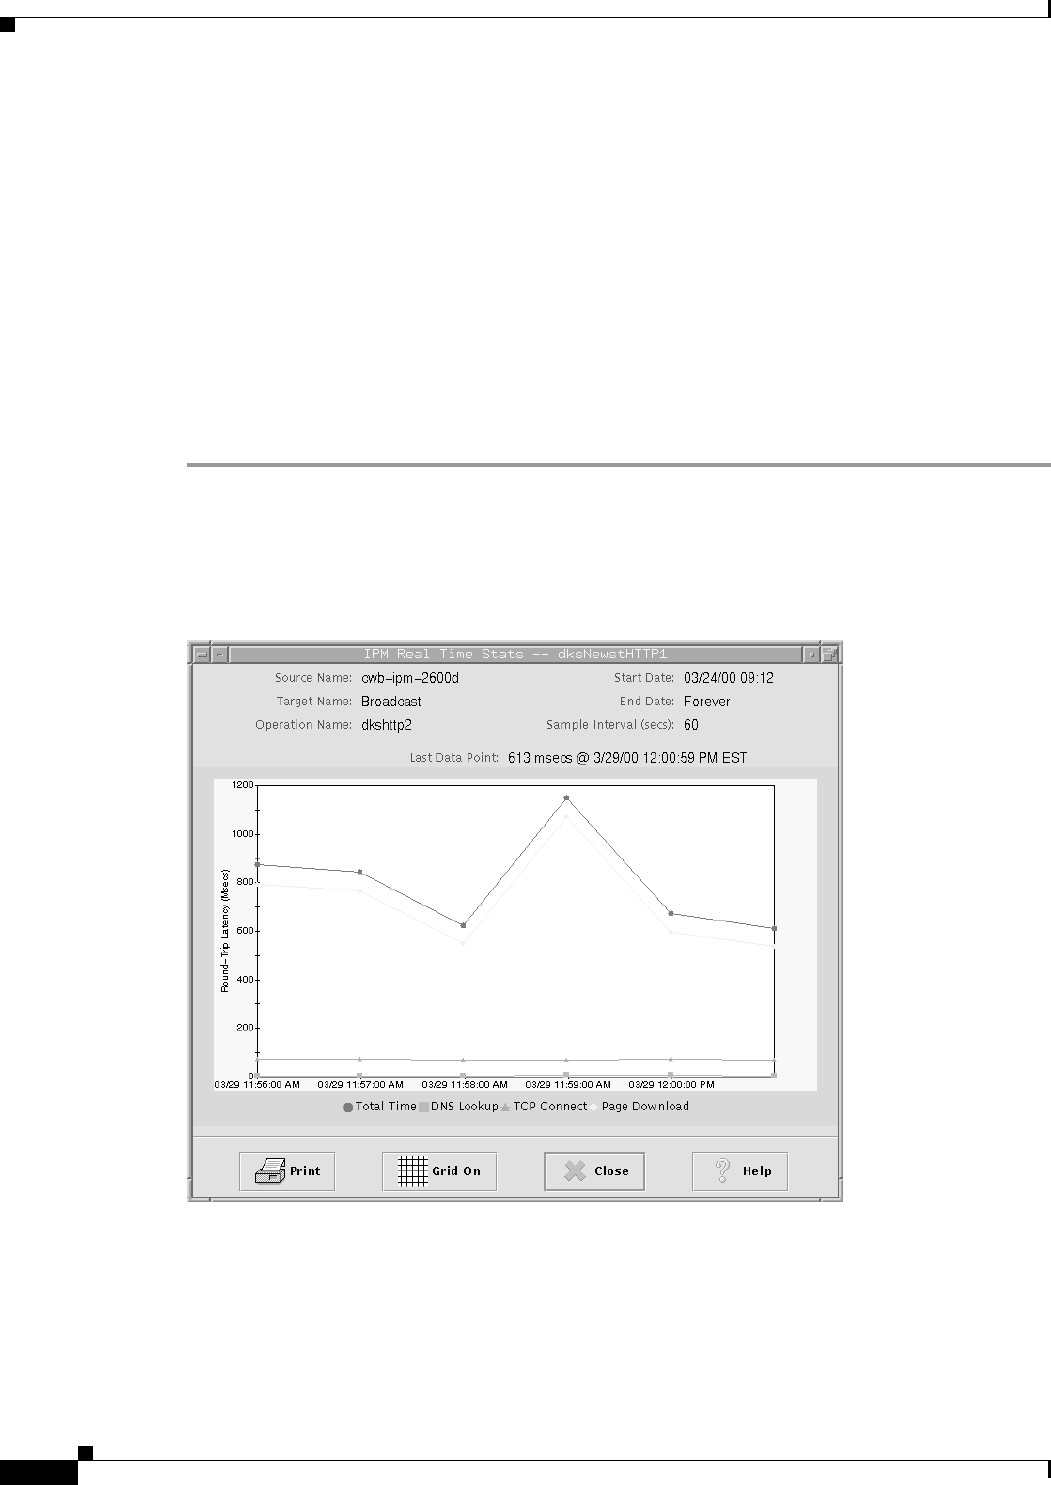
The Real Time Statistics window allows you to view statistics for an active collector as the data is being
collected. This data appears only in real time, it is not stored in the IPM database.
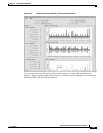
The Real Time Statistics window displays up to 1000 points of data; the most recent 1000 points are
always displayed. That is, when a real time graph reaches 1000 points of data, as the most recent points
are added to the right side of the graph the earliest points disappear from the left side. If you watch the
last data point at the far right of the graph, you can see it change at the end of a sampling interval.
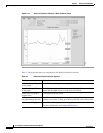
For example, if your sampling interval is once every 60 seconds, in less than a day the real time graph
will have reached 1000 points of data. After that time, you can see the last data point on the right of the
graph change every 60 seconds.
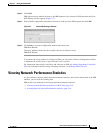
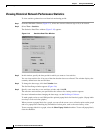
To view statistics in real time:
Step 1 From the IPM Main Window (Figure 2-2), select the collector to be viewed.
Step 2 Select View > Realtime Statistics.
The Real Time Statistics window (either Figure 2-8 or Figure 2-9) appears.
Figure 2-8 Real Time Statistics Window
39287