


2-25
User Guide for Internetwork Performance Monitor
OL-11291-01
Chapter 2 Getting Started With IPM
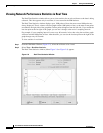
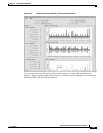
Viewing Network Performance Statistics
Request an immediate poll
of statistics
(single-collector graphs
only).
Select View > Demand Poll. IPM typically polls a collector once per
hour.
If you are between polls and do not want to wait until the next polling
period, you can use the Demand Poll function to request an immediate
poll of the collector. The graphs are updated with the new statistics.
If for some reason the poll fails and new statistics are not collected, the
following error message appears.
Demand Poll Failed, make sure router is available.
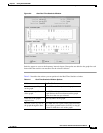
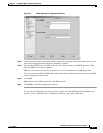
Change settings in the
Statistics Data Filter
window.
Select View > Filter Data to change the time period and granularity of the
graphs.
Display statistics for the
next time period.
Select View > Next Range. The graphs are updated to reflect the new
range.
For more information, see Understanding Next Range.
Display statistics for the
previous time period.
Select View > Prev Range. The graphs are updated to reflect the new
range.
For more information, see Understanding Previous Range.
Hide the legend bar at the
bottom of each graph.
Select View > Hide Legend.
Show the legend bar at the
bottom of each graph.
Select View > Show Legend.
Show combined statistics in
one graph for all paths in
the path list, or all hops in a
selected path (Path Echo
collectors only).
Select Path List, or select a specific path, then select
View > Show Combined.
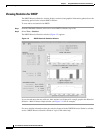
A single graph is displayed showing combined statistics for all the paths
in the path list (up to 128 paths), or all the hops in the hop list (up to 25
hops) for the selected path. The combined graph shows only average
statistics.
If a path has no data available, IPM displays (No Data) for that path in
the right side of the window.
If a path never reaches its target, it is an invalid path, and IPM displays
(No Target) for that path in the right side of the window.
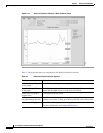
Show separate statistics in
one or more graphs for all
paths in the path list, or all
hops in a selected path
(Path Echo collectors only).
Select Path List, or select a specific path, then select
View > Show Separate. Multiple graphs are displayed, one for each path
in the path list, or hop in the hop list for the selected path. Each graph
shows minimum, maximum, and average statistics.
If a path has no data available, IPM displays No Data Available for that
path instead of a graph.
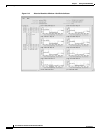
Table 2-3 Historical Statistics Window Options (continued)
To Action