


2-26
User Guide for Internetwork Performance Monitor
OL-11291-01
Chapter 2 Getting Started With IPM
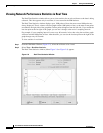
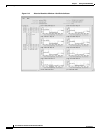
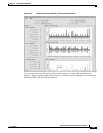
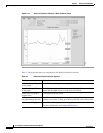
Viewing Network Performance Statistics
Understanding Next Range
Keep the following points in mind when you select View > Next Range:
• The new start time is the current end time. The new end time is the current end time, plus the current
duration.
For example, if the current start time is midnight April 11 and the current end time is midnight April
12, the duration is 24 hours. So the new start time is midnight April 12, and the new end time is
midnight April 13.
• The new end time might be later than the actual current time, even though you are displaying
historical statistics.
• If View > Next Range is grayed out, it means the new range falls after the collector was stopped.
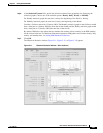
• If you select View > Next Range and IPM displays the following error message:
Could not get operation stats from the server for the given time range, chart will be
empty.
This means there was no statistical data available for the next time period. The IPM server or source
router might have been down during that time period, and no statistical data was collected. When
you click OK, IPM displays blank graphs for the next time period.
• If you select View > Next Range for a Path Echo collector and IPM displays the following error
message:
No Path List could be found. Forcing a demand poll. Wait a few minutes and try again.
This means there was no statistical data available for the next time period. The IPM server or source
router might have been down during that time period, and no statistical data was collected. When
you click OK, IPM still displays graphs for the current time period.
Understanding Previous Range
Keep the following points in mind when you select View > Prev Range:
• The new start time is the current start time, minus the current duration. The new end time is the
current start time.
For example, if the current start time is midnight April 11 and the current end time is midnight April
12, the duration is 24 hours. So the new start time is midnight April 10, and the new end time is
midnight April 11.
• If View > Prev Range is grayed out, it means the new range falls before the collector was started.
• If you select View > Prev Range and IPM displays the following error message:
Could not get operation stats from the server for the given time range, chart will be
empty.
This means there was no statistical data available for the previous time period. The IPM server or
source router might have been down during that time period, and no statistical data was collected.
When you click OK, IPM displays blank graphs for the previous time period.