


2-24
User Guide for Internetwork Performance Monitor
OL-11291-01
Chapter 2 Getting Started With IPM
Viewing Network Performance Statistics
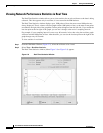
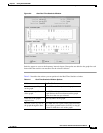
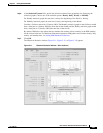
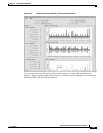
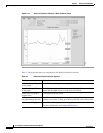
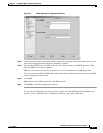
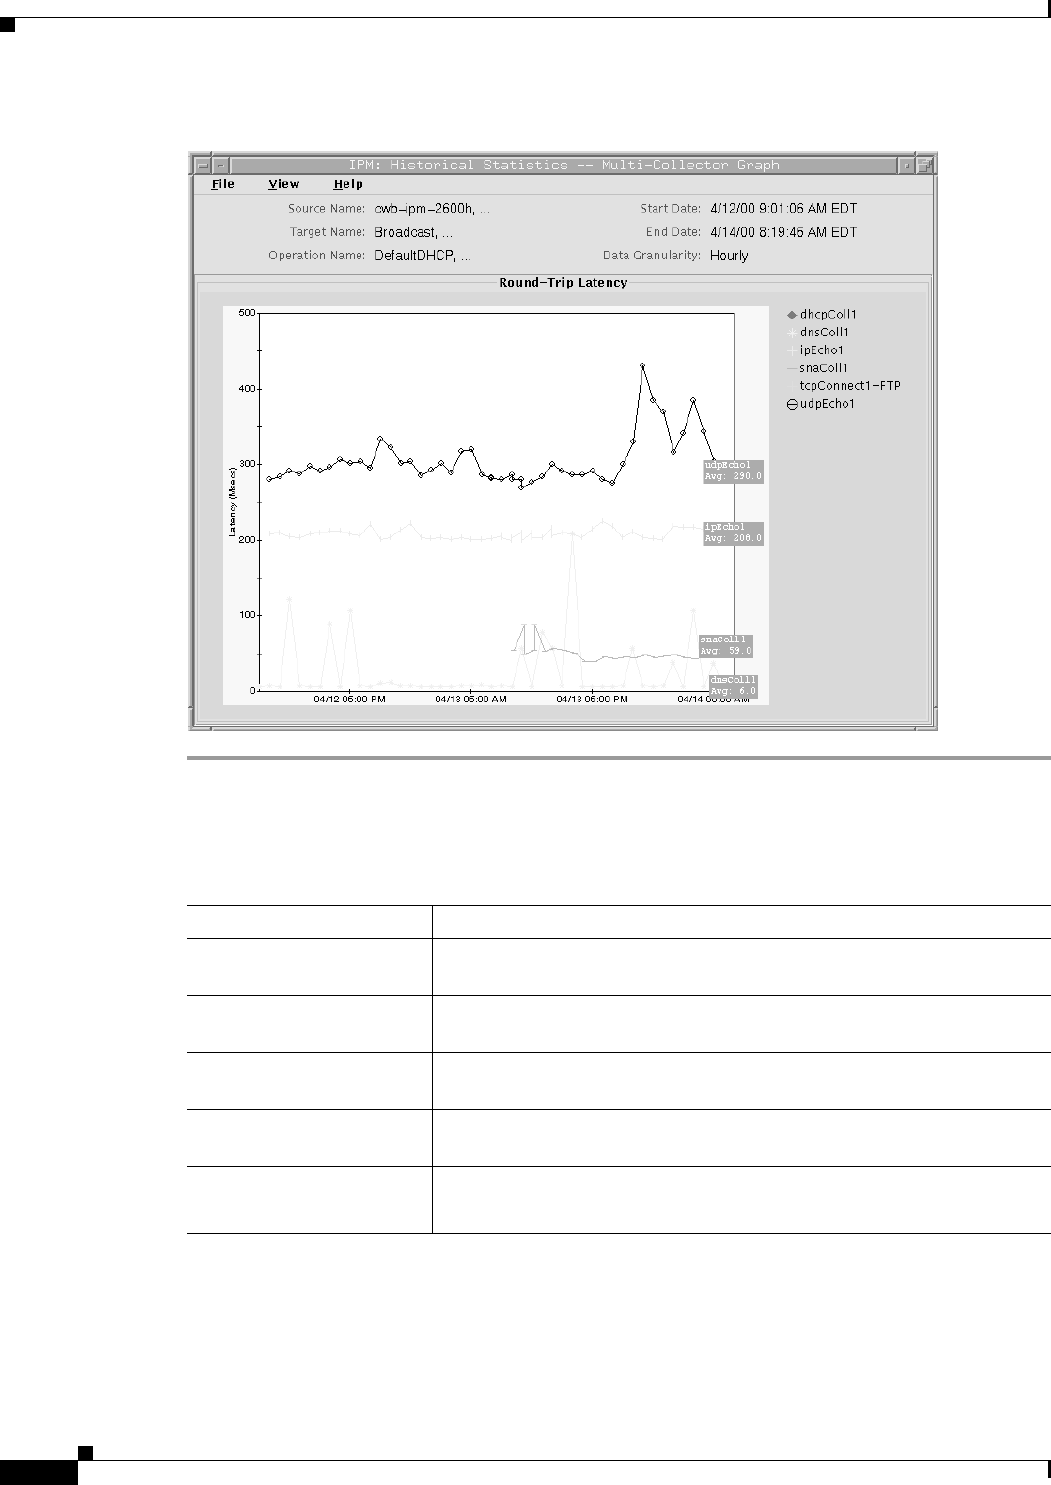
Figure 2-14 Historical Statistics Window—Multi-Collector Graph
Table 2-3 describes the tasks you can perform in the Historical Statistics window.
39290
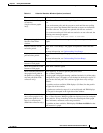
Table 2-3 Historical Statistics Window Options
To Action
Zoom in on a specific point
on the graph.
Press Shift and click a point on the graph.
Zoom in on a specific area
of the graph.
Press Shift and drag and click on an area of the graph. Release the mouse
button and the graph zooms in on the area you selected.
Zoom out to the graph’s
original view.
Click anywhere on the graph.
Shift the x-axis or y-axis of
the graph through the data.
Press Ctrl and click a point on the graph, then drag left or right to go
backward or forward, or drag up or down to shift the x-axis of the graph.
Print or save the graph. Select File > Print to print or save the graph.
For more information, see Printing IPM Statistics.