


2-20
User Guide for Internetwork Performance Monitor
OL-11291-01
Chapter 2 Getting Started With IPM
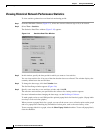
Viewing Network Performance Statistics
Viewing Historical Network Performance Statistics
To view statistics gathered over an historical monitoring period:
Step 1 From the IPM Main Window (Figure 2-2), select one or more collectors (up to 10) to be viewed.
Step 2 Select View > Statistics.
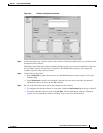
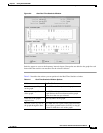
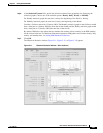
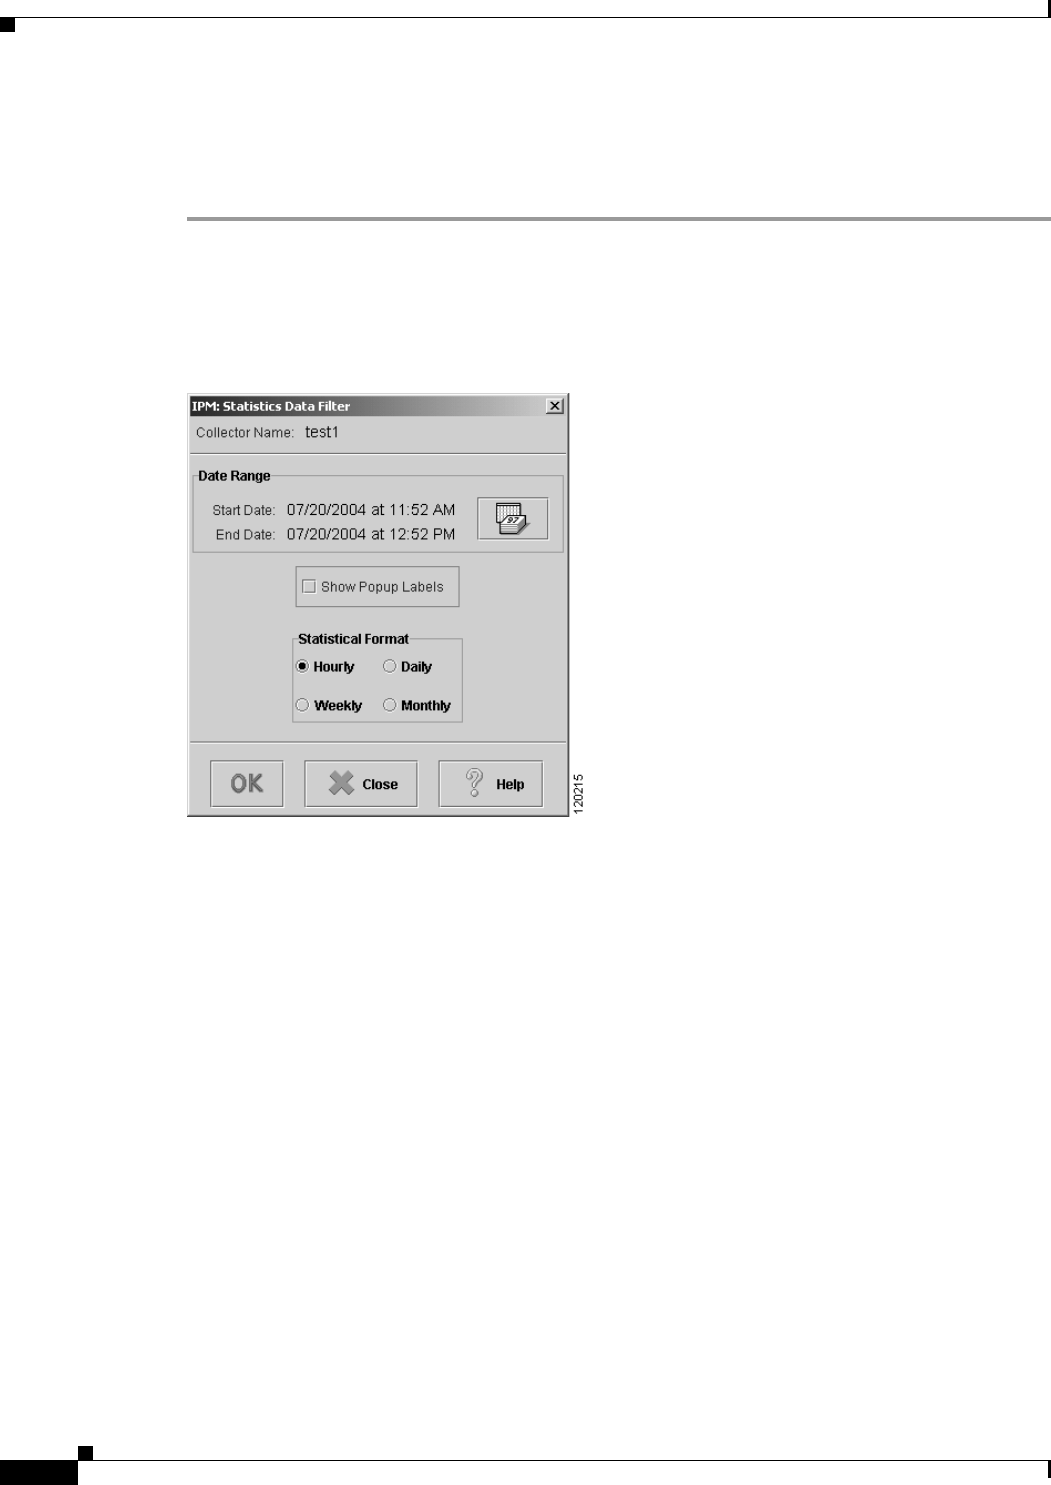
The Statistics Data Filter window (Figure 2-10) appears.
Figure 2-10 Statistics Data Filter Window
Step 3
In this window, specify the time period for which you want to view statistics.
You can view statistics for all or part of the time that the data was collected. The window displays the
currently defined start date and end date.
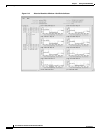
Step 4 To change the date range, click the Calendar icon.
The Set Date Range window appears (Figure 2-6).
Step 5 Specify a new start date, a new end date, or both, and click OK.
The start time and end time you specified for the collector for viewing statistics appears.
For more information about changing the date range, see the Defining a Collector.
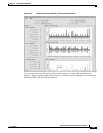
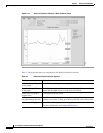
To make graphs easier to read, IPM provides optional popup labels for historical graphs. (Popup labels
are always on for real-time graphs.)
When you turn on popup labels for a graph, you can roll the cursor over a collection point on the graph
and see a popup label containing key information for that point, such as the exact latency value.
To turn on popup labels for a graph, select the Show Popup Labels checkbox. To turn off popup labels,
clear the checkbox.