


2-21
User Guide for Internetwork Performance Monitor
OL-11291-01
Chapter 2 Getting Started With IPM
Viewing Network Performance Statistics
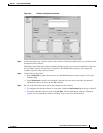
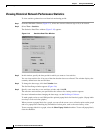
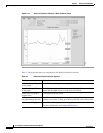
Step 6 In the Statistical Format field, specify the initial increment for the granularity for displaying the
statistical graphs. Choose one of the available options: Hourly, Daily, Weekly, or Monthly.
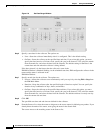
For Weekly statistical graph, the start time is always the beginning of the Week i.e. Sunday.
For Monthly statistical graph, the start time is always the beginning of the Month.
Consider a Collector started on 15 January 2004. The Monthly statistical graph for that Collector would
have a time plot on 1 January 2004 (the start date of that month) and the Weekly statistical graph would
have a time plot on 13 January 2004 (the start date of that week)
By default, IPM selects the option that best matches the amount of data currently in the IPM database
for the selected collector. For additional information about how IPM gathers and calculates hourly, daily,
weekly, and monthly data, see Setting IPM Database Preferences.
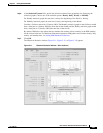
Step 7 Click OK.
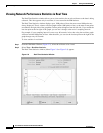
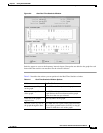
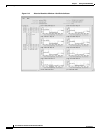
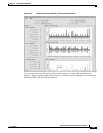
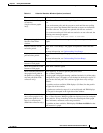
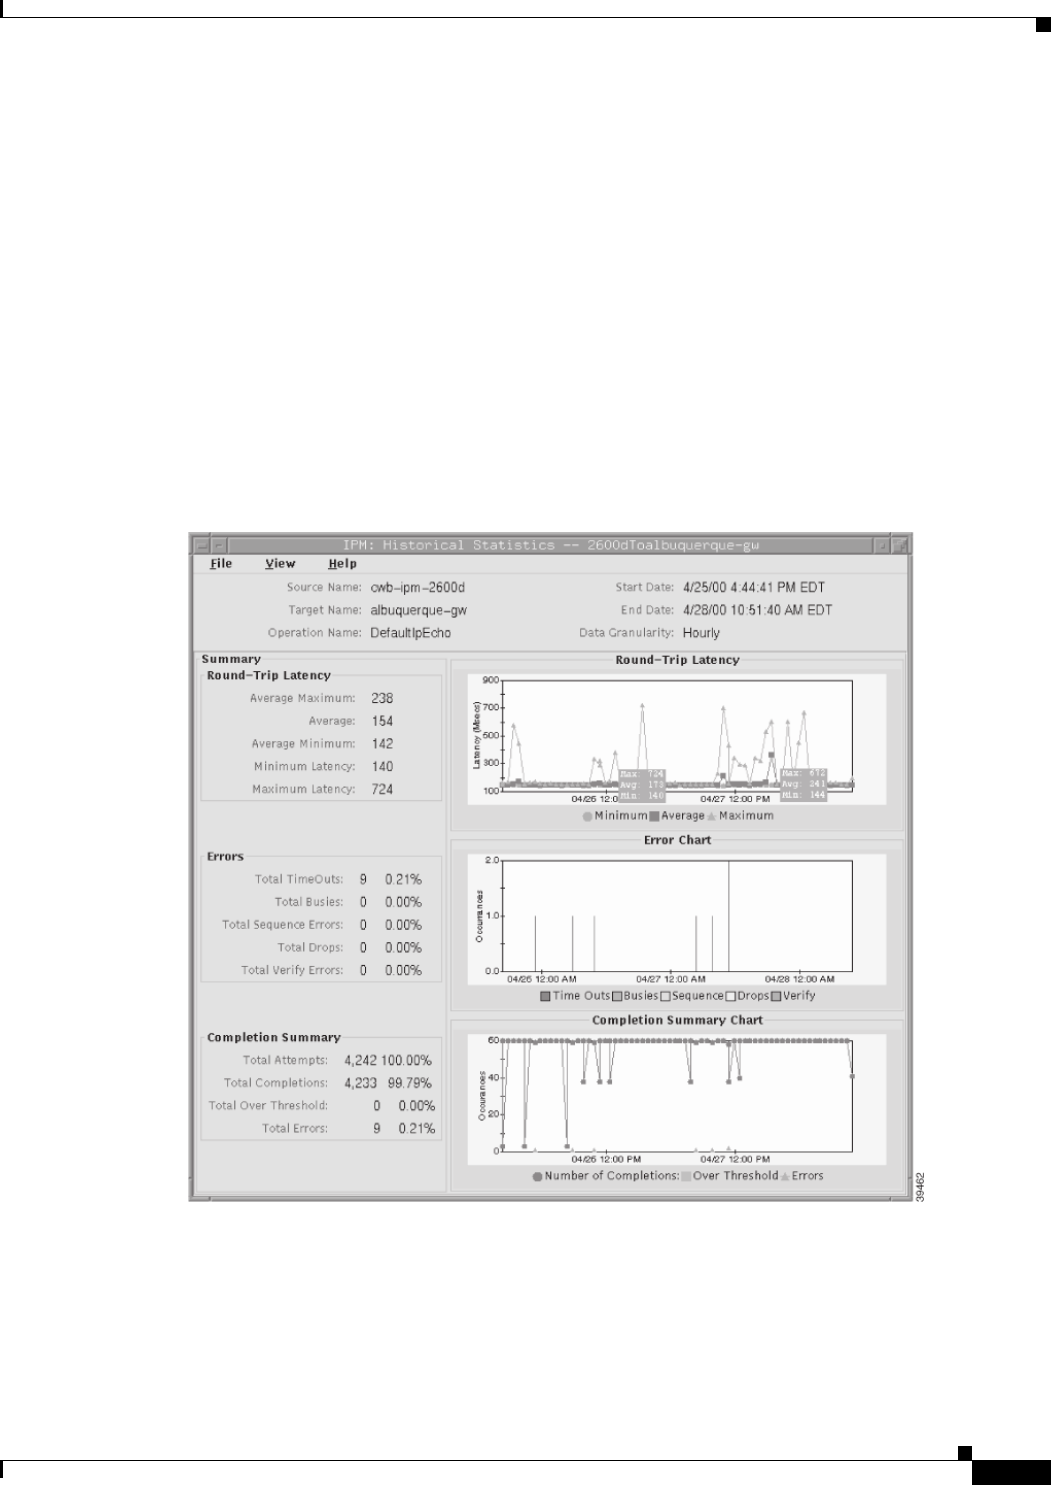
The Historical Statistics window (Figure 2-11, Figure 2-12, or Figure 2-13) appears.
Figure 2-11 Historical Statistics Window—Echo Collector