


2-19
User Guide for Internetwork Performance Monitor
OL-11291-01
Chapter 2 Getting Started With IPM
Viewing Network Performance Statistics
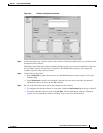
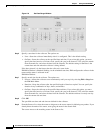
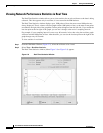
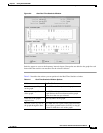
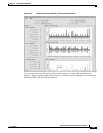
Figure 2-9 Jitter Real Time Statistics Window
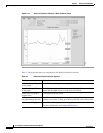
Statistics appear as soon as the frequency interval elapses. Data points are added to the graph for each
interval that the statistics are measured for the selected collector.
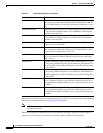
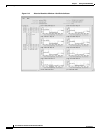
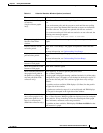
Table 2-2 describes the actions you can perform in the Real Time Statistics window.
39288
Table 2-2 Real Time Statistics Window Options
Action Key Combination
Zoom in on a specific point
on the graph.
Press Shift and click a point on the graph.
Zoom in on a specific area
of the graph.
Press Shift and drag and click on an area of the
graph. Release the mouse button and the graph
zooms in on the area you selected.
Zoom out to the graph’s
original view.
Click anywhere on the graph.
Shift the x-axis or y-axis of
the graph through the data.
Press Ctrl and click a point on the graph, then drag
left or right to go backward or forward, or drag up
or down to shift the x-axis of the graph.