


Installation and Use Manual 73
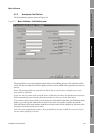
Meter Verification
Meter Verification Transmitter TerminalsData LoggerTransmitter Configuration
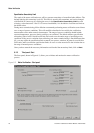
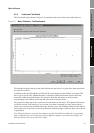
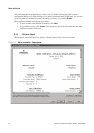
6.2.4 Fourth panel: Test Results
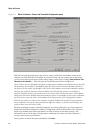
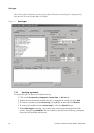
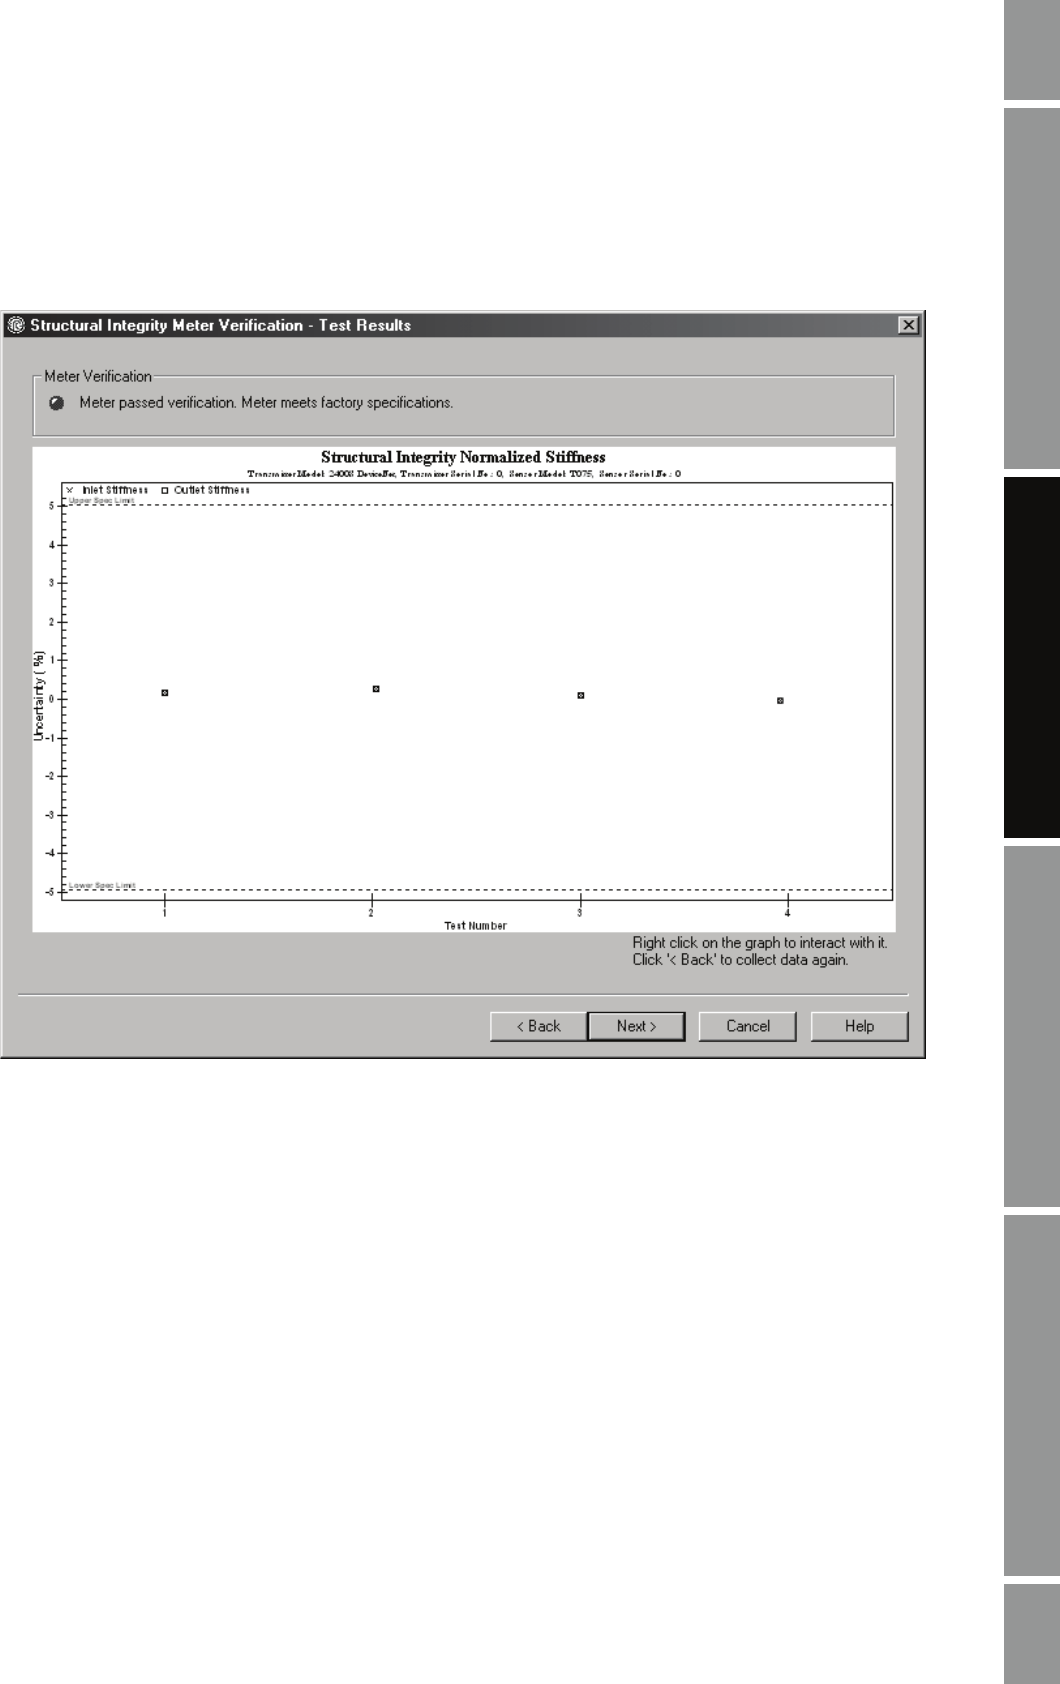
The Test Results panel, shown in Figure 6-4, summarizes the result of the meter verification test.
Figure 6-4 Meter Verification - Test Results panel
The indicator located at the top of the panel indicates the test result. It is green if the meter passed the
test and red if it failed.
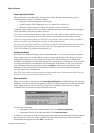
In addition to the pass/fail indicator, ProLink II shows the changes in tube stiffness on a graph. This
allows you to see not only whether the meter is operating within specification, but also where the
results fall within the specified limits. For each test, the results are shown as two data points
corresponding to the stiffness at the inlet and at the outlet of the flow tubes.
This graph also shows the results of previous tests performed on this meter. The rightmost data points
are the most recent. This history lets you see how your meter is trending over time, which can be a
useful way to detect meter problems before they become severe. The trending of both the inlet and the
outlet points over several tests can also help determine whether changes to the flow tubes are localized
or generalized.
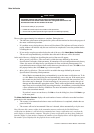
Note: Historical data are stored on the computer on which ProLink II is installed. If you performed
meter verification tests on the same meter from a different computer or from the meter display, the
historical data for these tests will not be visible.