


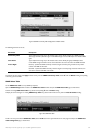
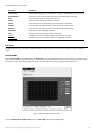
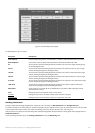

The following fields may be set or viewed:
Parameter Description
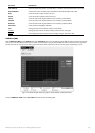
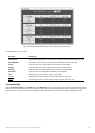
Time Interval
Select the desired setting between 1s and 60s,where "s" stands for seconds.The default value is one second.
Record Number Select number of times the Switch will be polled between 20 and 200.The default value is 200.
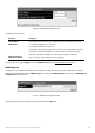
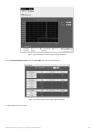
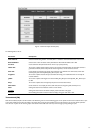
Bytes Counts the number of bytes successfully sent from the port.
Packets Counts the number of packets successfully sent on the port.
Unicast Counts the total number of good packets that were transmitted by a unicast address.
Multicast Counts the total number of good packets that were transmitted by a multicast address.
Broadcast Counts the total number of good packets that were transmitted by a broadcast address.
Show/Hide Check whether or not to display Bytes and Packets.
Clear Clicking this button clears all statistics counters on this window.
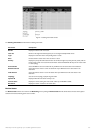
Vie
w Table Clicking this button instructs the Switch to display a table rather than a line graph.
View Line Chart Clicking this button instructs the Switch to display a line graph rather than a table.
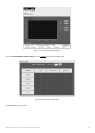
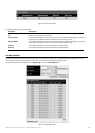
9-4 Errors
The
Web Manager allows port error statistics compiled by the Switch's management agent to be viewed as either a line graph or a table.Four windows are
off
ered.
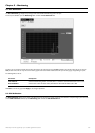
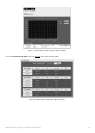
Received (RX)
Click the Received (RX) link in the Error folder of the Monitoring menu to view the following graph of error packets received on the Switch.To select a
port to view these statistics for,first select the Switch in the switch stack by using the Unit pull-down menu and then select the port by using the Port pull down
menu.The user may also use the real-time graphic of the Switch and/or switch stack at the top of the web page by simply clicking on a port.
Figure 9- 9.Rx Error Analysis window (line graph)
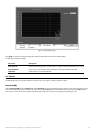
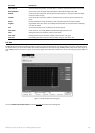
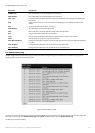
To view the
Received Error Packets Table,click the link View Table,which will show the following table:
162
Allied Telesyn AT-9724TS High-Density Layer 3 Stackable Gigabit Ethernet Switch