


194 Chapter 12 Working with the Mail Service
Mail serveradmin Commands
You can use the following commands with the serveradmin tool to manage mail
service.
Listing Mail Service Statistics
You can use the serveradmin getHistory command to display a log of periodic
samples of the number of user connections and the data throughput. Samples are
taken once each minute.
To list samples:
$ sudo serveradmin command
mail:command = getHistory
mail:variant =
statistic
mail:timeScale =
scale
Control-D
The computer responds with the following output:
mail:nbSamples = <samples>
mail:v2Legend = "throughput"
mail:samplesArray:_array_index:0:v
n
= <sample>
mail:samplesArray:_array_index:0:t = <time>
mail:samplesArray:_array_index:1:v
n
= <sample>
mail:samplesArray:_array_index:1:t = <time>
[...]
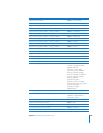
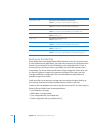
Command (mail:command=) Description
getHistory View a periodic record of file data throughput or number of user
connections. See “Listing Mail Service Statistics” on this page.
getLogPaths Display the locations of the Mail service logs. See “Viewing the Mail
Service Logs” on page 195.
writeSettings Equivalent to the standard serveradmin settings command,
but also returns a setting indicating whether the service needs to
be restarted. See “Using the serveradmin Tool” on page 48.
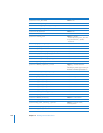
Parameter Description
statistic
The value you want to display.
Valid values:
v1—Number of connected users (average during sampling period)
v2—Data throughput (bytes/sec)
scale
The length of time in seconds, ending with the current time, for
which you want to see samples. For example, to see 24 hours of
data, you would specify
mail:timeScale = 86400.