3
3-14 Color Calibration
With the Print Pages option, you can print a calibration Comparison Page
showing the results of the new measurements with any profile associated with
the currently selected calibration set. You can also create a custom
comparison page and save it as a PostScript or an Encapsulated PostScript
(EPS) file called CALIB.PS. Then print the file to the Hold Queue of the
iR C2100/2100S from your application or download it to the Hold Queue
with Fiery Downloader. An additional way to create the CALIB.PS file is to
rename any job in the Hold Queue using Command WorkStation.
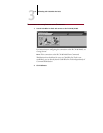
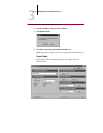
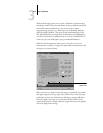
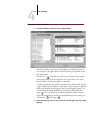
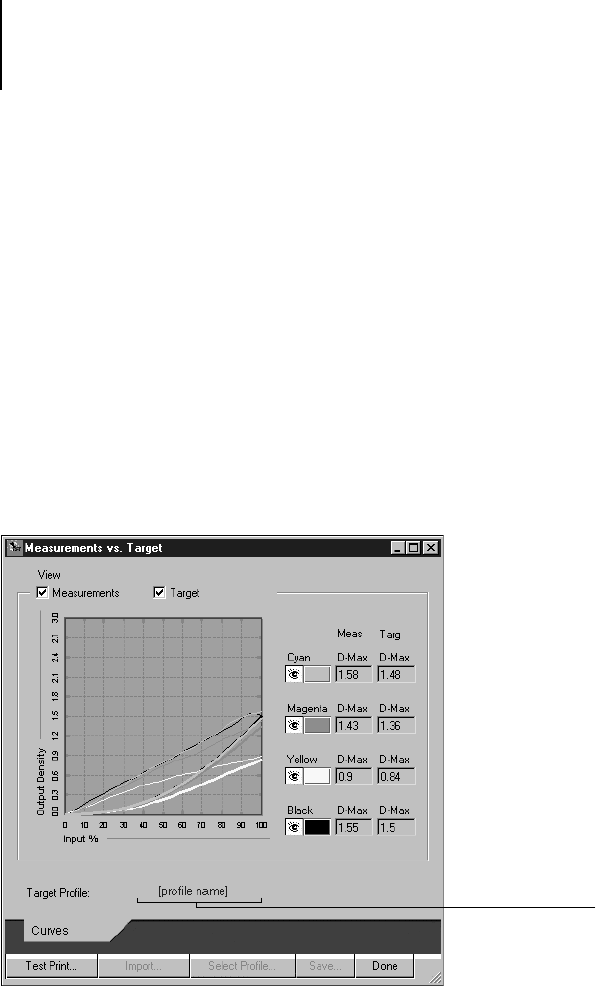
With the View Measurements option, you can view the current set of
measurements as a table or as a graph that shows both the measurements and
the target curves (shown below).
When more than one profile use the same target, an additional menu called
Plot Against appears at the top right of the window above. It lists all output
profiles that use that same calibration set. Selecting an output profile from
this menu displays the target curves associated with that profile. If each
output profile contains a unique calibration target, when you switch profiles,
the curves displayed also change.
Output profile name
appears here


