1
1-20
McDATA® Sphereon™ 4500 Fabric Switch Product Manager User Manual
Product Manager Overview
installed, whether the FRU was inserted or removed, the FRU
part number and serial number, and the date and time the FRU
was inserted or removed.
Link Incident Log
The link incident (LIN) log displays the most recent incidents
with their date and time, port number, and description of the
incident. A link incident can be one of several conditions detected
on a fiber optic link. For a list of events that may cause a link
incident to be written to the log, refer to Link Incident Log on
page 4-8.
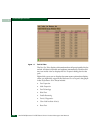
Threshold Alert Log
This log provides notifications of threshold alerts. Besides the
date and time that the alert occurred, it also displays information
that was configured through the Configure Threshold Alert(s)
option under the Configure menu. This includes the alert name,
port for which the alert is configured, the type of alert (transmit
throughput, receive throughput, or both), threshold utilization of
traffic capacity, minutes the threshold was configured for, and the
configured time interval for the threshold. For more details on
this log, refer to Threshold Alert Log on page 4-10.
Maintenance Menu
Click on the Maintenance menu on the menu bar to display a list of the
following options. For detailed information on using these dialog
boxes, refer to Chapter 5, Using Maintenance Features.
Port Diagnostics
This option displays the Port Diagnostics dialog box. Use this
dialog box to run internal and external loopback tests on ports.
Refer to the McDATA Sphereon 4500 Fabric Switch Installation and
Service Manual (620-000159) for instructions.
Data Collection
This option displays the Save Data Collection dialog box. Use this
dialog box to collect maintenance data into a file. This file is used
by support personnel to diagnose system problems. Refer to the
McDATA Sphereon 4500 Fabric Switch Installation and Service
Manual (620-000159) for instructions.


