


Chapter 6 Viewing system statistics 111
Using Web-based Management for the BayStack 380-24F Gigabit Switch
Viewing Ethernet error statistics in a pie chart format
You can view Ethernet Errors statistics in a pie chart format.
To view Ethernet Errors statistics in a pie chart format:
1 From the main menu, choose Statistics > Ethernet Errors.
The Ethernet Errors page opens (Figure 45 on page 109).
2 In the port row of your choice, click the pie chart icon.
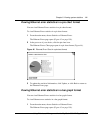
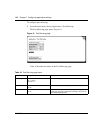
The Ethernet Errors: Chart page opens in a pie chart format (Figure 46).
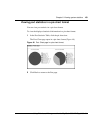
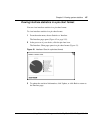
Figure 46 Ethernet Error: Chart in a pie chart format
3 To update the statistical information, click Update, or click Back to return to
the Ethernet Errors page.
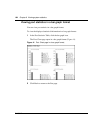
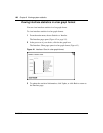
Viewing Ethernet error statistics in a bar graph format
You can view Ethernet Errors statistics in a bar graph format.
To view Ethernet errors statistics in a bar graph format:
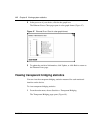
1 From the main menu, choose Statistics > Ethernet Errors.
The Ethernet Errors page opens (Figure 45 on page 109).