


112 Chapter 6 Viewing system statistics
214394-A
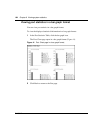
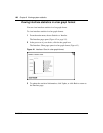
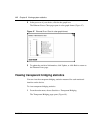
2 In the port row of your choice, click the bar graph icon.
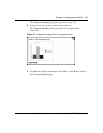
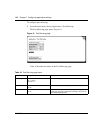
The Ethernet Errors: Chart page opens in a bar graph format (Figure 47).
Figure 47 Ethernet Error: Chart in a bar graph format
3 To update the statistical information, click Update, or click Back to return to
the Ethernet Errors page.
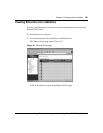
Viewing transparent bridging statistics
You can view the transparent bridging statistics measured for each monitored
interface on the device.
To view transparent bridging statistics:
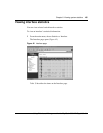
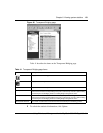
1 From the main menu, choose Statistics > Transparent Bridging.
The Transparent Bridging page opens (Figure 48).