


98 Chapter 5 Configuring remote network monitoring (RMON)
214394-A
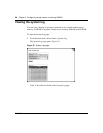
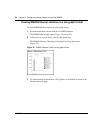
Viewing RMON statistics in a line graph format
You can view RMON statistical data in a line graph format.
To view statistics in a line graph format:
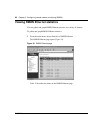
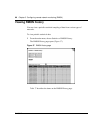
1 From the main menu, choose Statistics > RMON History.
The RMON History page opens (Figure 37 on page 97).
2 In the RMON History Statistics Table, click the line graph icon.
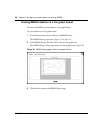
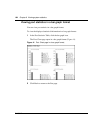
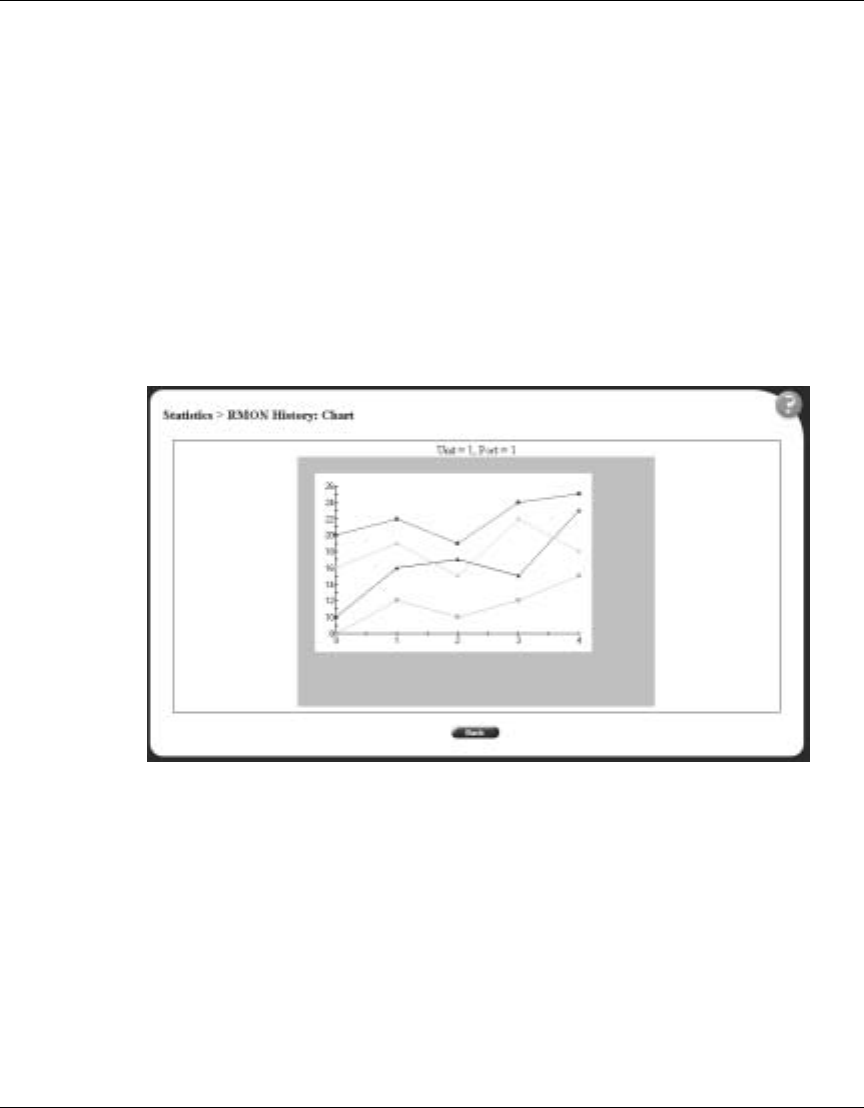
The RMON History: Chart page opens in a line graph format (Figure 38).
Figure 38 RMON History page: Chart in line graph format
3 Click Back to return to the RMON History page.