


262 AT-WR4500 Series - IEEE 802.11abgh Outdoor Wireless Routers
RouterOS v3 Configuration and User Guide
12.4 Graphing
Document revisi on: 1.1 (Wed Mar 15 09:46: 17 GMT 2006)
Applies to: V2.9
12.4.1 General Information
Summary
Graphing is a tool which is used for monitoring various RouterOS parameters over a period of time.
Specifications
Packages required: system, routerboard(optional)
License required: Level1
Submenu level: /tool graphing
Hardware usage: Not significant
Description
The Graphing tool can display graphics for:
• Routerboard health (voltage and temperature)
• Resource usage (CPU, Memory and Disk usage)
• Traffic which is passed through interfaces
• Traffic which is passed through simple queues
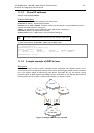
Graphing consists of two parts - first part collects information and other part displays data in a Web page.
To access the graphics, type http://[Router_IP_address]/graphs/ and choose a graphic to display in
your Web browser.
Data from the router is gathered every 5 minutes, but saved on the system drive every store-every
time. After rebooting the router, graphing will display information that was last time saved on the disk
before the reboot.
RouterOS generates four graphics for each item:
• "Daily" Graph (5 Minute Average)
• "Weekly" Graph (30 Minute Average)
• "Monthly" Graph (2 Hour Average)
• "Yearly" Graph (1 Day Average)
To access each graphic from a network, specify this network in allow-address parameter for the
respective item.
12.4.2 General Options
Submenu level: /tool graphing
Property Description
store-every (5min | hour | 24hours; default: 5min) - how often to store information on system drive
Example
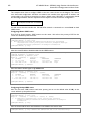
To store information on system drive every hour:
/tool graphing set store-every=hour
[admin@AT-WR4562] tool graphing> print
store-every: hour
[admin@AT-WR4562] tool graphing>