


Creating Custom Trend Bar Graphs (ION 7500 / ION 7600 only) ION 7500 / ION 7600 User’s Guide
Page 200 Custom Front Panel Displays Technical Note
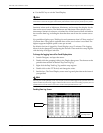
4. Select VALUES to change the displayed parameter in the selected screen.
When you change the value displayed on a screen, you are presented with a
complete list of the meter’s measurements. Using the lists of modules provided,
select the values you want to have displayed on that display screen.
The number of V
ALUES you can select is a function of the STYLE setting. You
cannot select more values than the S
TYLE is set to display.
Creating Custom Trend Bar Graphs (ION 7500 / ION 7600 only)
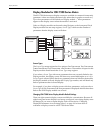
Bar Graph displays are configured differently than other numeric parameter
displays. Each bar in the display is associated with three specific Source inputs as
follows:
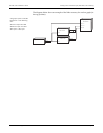
Typically, the minimum and maximum values for each bar graph come from links
to the outputs of Minimum and Maximum ION modules that are themselves
linked to the real-time parameter shown in the bar graph.
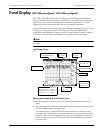
NOTE
This feature works only if the meter’s Volts Mode is NOT set to Demo. When the meter is in Demo mode,
a default trending log showing Vll ab, Ia, PF and KW will be displayed rather than the actual log that has
been linked to the Display module.
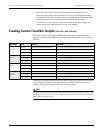
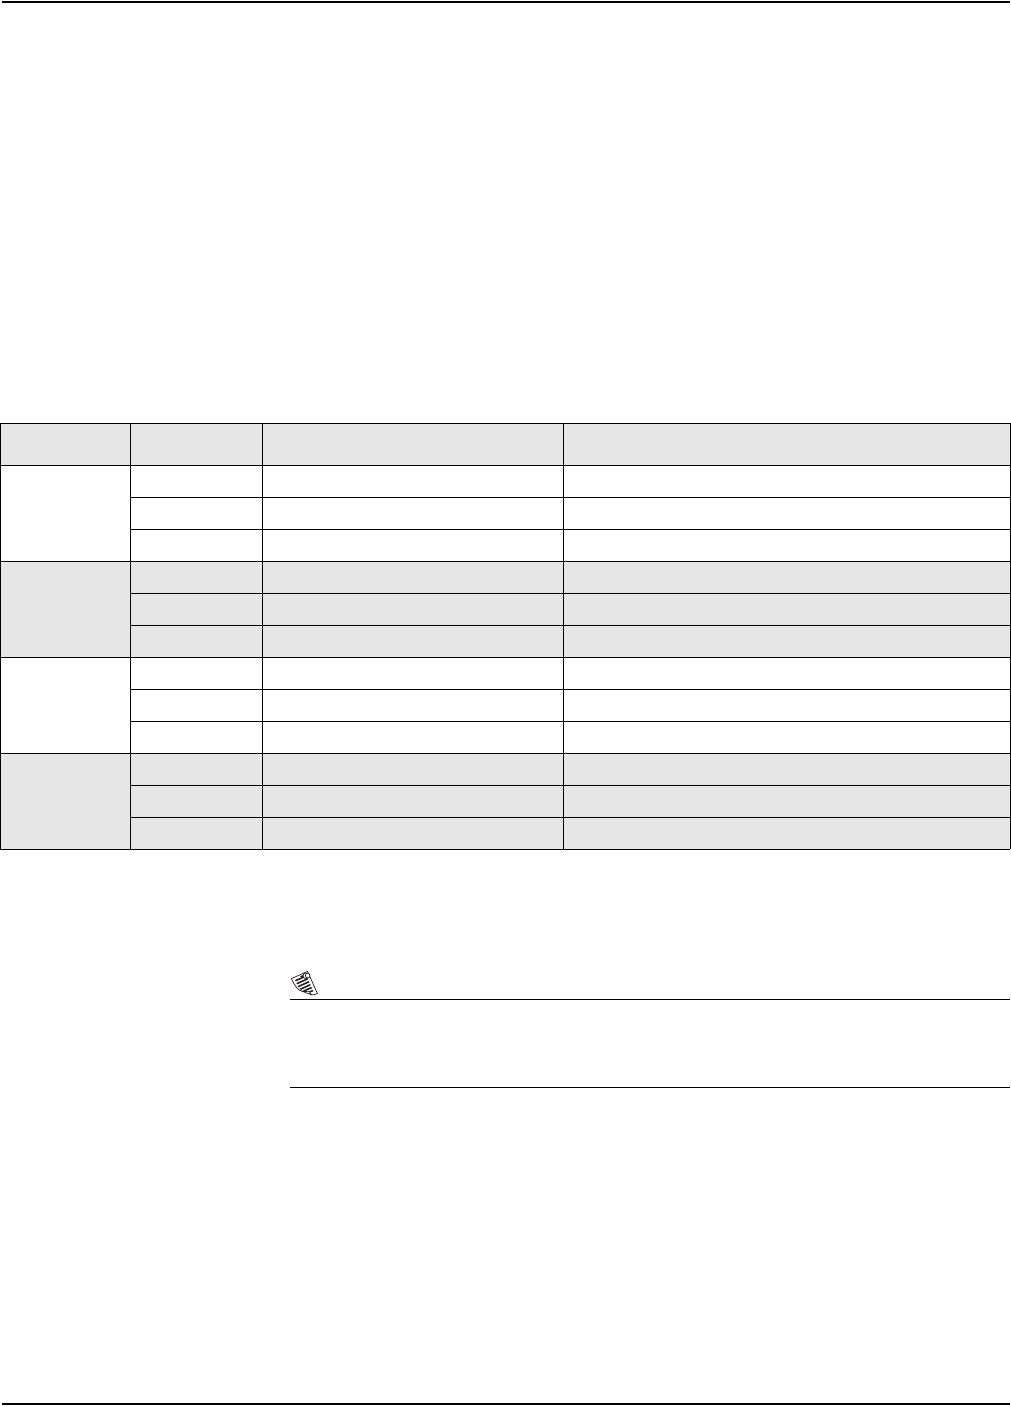
Bar Graph Input Function Attributes
First (top)
Source 1 Real-Time value for Bar Graph #1 Bar graph #1 will not appear if you do not link this input
Source 2 Minimum value for Bar Graph #1 Link to the output of a Minimum module
Source 3 Maximum for Bar Graph #1 Link to the output of a Maximum module
Second
Source 4 Real-Time value for Bar Graph #2 Bar graph #2 will not appear if this input is not linked
Source 5 Minimum for Bar Graph #2 Link to the output of a Minimum module
Source 6 Maximum for Bar Graph #2 Link to the output of a Maximum module
Third
Source 7 Real-Time value for Bar Graph #3 Bar graph #3will not appear if this input is not linked
Source 8 Minimum for Bar Graph #3 Link to the output of a Minimum module
Source 9 Maximum for Bar Graph #3 Link to the output of a Maximum module
Fourth
(bottom)
Source 10 Real-Time value for Bar Graph #4 Bar graph #4 will not appear if this input is not linked
Source 11 Minimum for Bar Graph #4 Link to the output of a Minimum module
Source 12 Maximum for Bar Graph #4 Link to the output of a Maximum module