


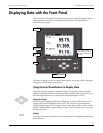

ION 7500 / ION 7600 User’s Guide Default Front Panel Display Screens
Chapter 2 - Using The Front Panel Page 29
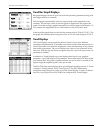
35. TOU Egy (TOU Energy Del)
This numeric display screen shows the energy (in kWh) delivered for each time
of use (TOU) rate (rates A, B, C, and D).
36, 37. TOU Dmd1 & TOU Dmd2 (TOU Peak Demand 1 and 2)
These two screens are numeric displays with timestamps. Together they show
the maximum delivered kilowatts for each time of use (TOU) rate (rates A, B, C,
and D). The timestamps show the date and time at which the values were last
updated. By default, these values come from a sliding window demand (rolling
block) calculation.
NOTE
The four TOU screens may only be important if you are using the meter in a billing application (i.e. you
are a power provider). Typically, power consumers ignore the Time-Of-Use front panel displays.
EN50160 Data and Statistics Displays (ION 7600 only)
The remaining front panel screens display data to help you determine EN50160
voltage compliance. Unless compliance to this standard is of concern, you may
ignore these displays. More details about EN50160 are provided in the technical
note Power Quality: ION Meters and EN50160.
38. PQ Freq (PQ Power Frequency)
This numeric display shows the following EN50160 Power Frequency data:
Nominal Frequency, period (10 second) Freq mean, minimum, and maximum.
It also shows the EN50160 frequency compliance statistics: Freq N (the number
of valid evaluation periods), Freq N
1
(a count of non-compliance), and Freq N
2
(the number of invalid evaluation periods).
39. PQ Vmag1 (PQ Supply Voltage 1)
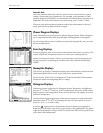
This bar graph display shows the following EN50160 Voltage Magnitude data
for all three voltage phases: period (10 minute) mean, minimum, and maximum.
40. PQ Vmag2 (PQ Supply Voltage 2)
This numeric display shows the following EN50160 Voltage Magnitude
compliance statistics for all three voltage phases: mag N and mag N1.
41. PQ Flk1 (PQ Flicker 1)
This bar graph display shows the following EN50160 Flicker data for all three
voltage phases: present Pst, minimum Pst, and maximum Pst.
42. PQ Flk2 (PQ Flicker 2)
This numeric display shows the following EN50160 Flicker data for all three
voltage phases: present Pst, present Plt, and compliance statistics (Flck N and
Flck N
1
).
43. PQ Vdist (PQ Volt Disturbance)
This numeric display shows the following EN50160 Overvoltage and Dip data
for all three voltage phases: expected nominal, minimum Dip, and maximum
Overvoltage.