


145
Chapter 10
Statistics & Regression
Calculations
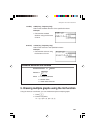
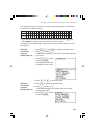
The following table shows the access counts (per hour) of a certain web site
from Sunday midnight to Monday midnight.
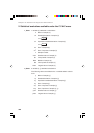
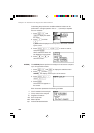
Let’s input these data into the calculator (List
function) and plot a histogram.
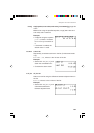
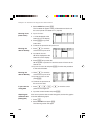
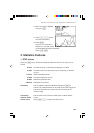
1. Press S.
The Stat menu will appear.
Hours
01 02 03 04 05 06 07 08 09 10 11 12 13 14 15 16 17 18 19 20 21 22 23 24
Sunday
98 72 55 3 6 24 15 30 59 72 55 43 21 10 150 151 135 108 204 253 232 251 75 30
Monday
32 8 12 2 4 19 32 72 95 91 123 201184 108 95 72 45 38 75 111 153 90 84 35