


57
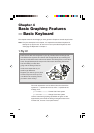
Chapter 4: Basic Graphing Features — Basic Keyboard
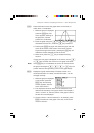
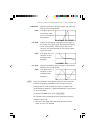
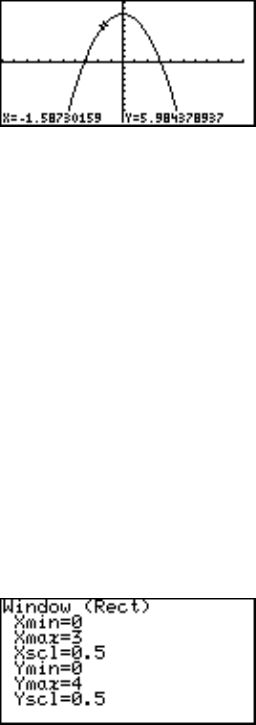
U: Press this button to trace the graph drawn on the screen, to
obtain the X-Y coordinates:
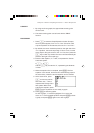
1. While the graph is displayed,
press the U key. The
cursor appears, flashing on
the graph line, with the
present X-Y coordinates.
2. Trace the graph using the ; or ' keys. The ; key
decreases the value of x, while the ' key increases it.
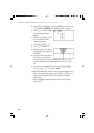
3. Pressing the U key again will redraw the graph, with the
cursor at the center of the screen. If the cursor is moved
beyond the range of the screen, pressing the U key will
redraw the screen centered around the cursor.
4. When done, press the C key to escape the tracing
function.
If more than one graph is displayed on the screen, use the {
or } keys to switch the cursor from one graph to the other.
Note: If the U key is not activated, the cursor will not be bound to
the graph. Pressing the ;, ', {, or } keys will
position the free-moving flashing cursor on the graph display.
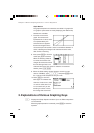
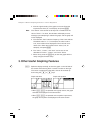
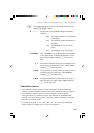
W: Displays the graph window setup. The setup values — the
minimum/maximum X/Y values, and X/Y-axis scale — can be
changed manually:
1. While the graph is displayed
on the screen, press the
W key. The following
window appears, with the
cursor set at “Xmin=”.
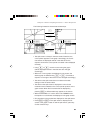
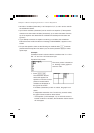
2. The required X-minimum value can be entered here. This
limits the left boundary of the graph window. For example, if
“Xmin=” is set to “0”, then the portion of the graph’s Y-axis to
the left will not be displayed.
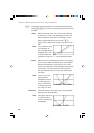
3. Once the “Xmin=” value is entered (“0”, for example), press
E. The left limit of the graph is now set, and the cursor
moves to “Xmax=”.