


59
Chapter 4: Basic Graphing Features — Basic Keyboard
Y
G
GY
G@ " Y@ "
@ "
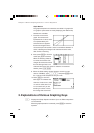
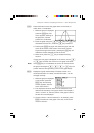
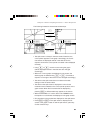
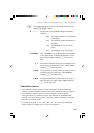
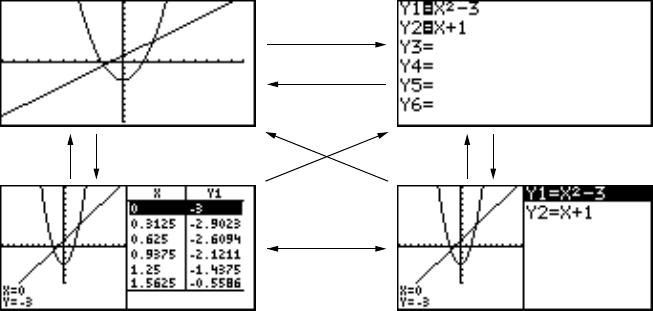
The following illustration shows these relationships.
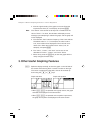
• The split screen is always in the trace mode. Therefore, the
cursor pointer appears on the graph. Accordingly, the coordi-
nate values are displayed reverse in the table and in the
equation at which the cursor pointer is located is also displayed
reversely.
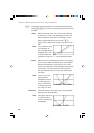
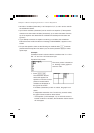
• Using ; or ', move the cursor along the graph.
(Values displayed reverse in the table are also changed
accordingly.)
• When two or more graphs are displayed on the screen, the
desired graph is selected using { or }. (The table or
equation on the right of the screen is also changed accordingly.)
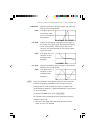
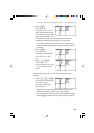
• The table on the split screen does not relate to the table
settings on the full-screen table.
• The table on the split screen is displayed in units of trace
movement amount based on the cursor pointer position on the
graph screen. When the full-screen table is displayed by
pressing T, a different table may appear on the screen.
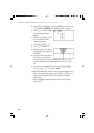
• When the EXPRES or Y’ is set to ON on the FORMAT menu,
the equation or coordinates are displayed on the graph screen.
• Only equations to be graphed are displayed on the split screen.
• Press G or T on the split screen to display the full-
screen of the graph or table. To exit the split screen, press any
of other function keys.