


52
Chapter 4: Basic Graphing Features — Basic Keyboard
Graph Basics
The graph examples in this exercise are called X-Y graphs. An
X-Y graph is quite useful for clearly displaying the relationship
between two variables.
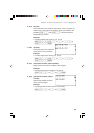
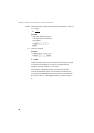
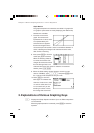
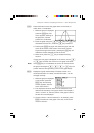
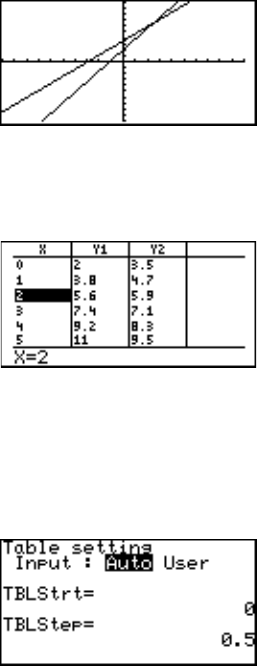
7. Let’s take a look at the
graph. The vertical axis
represents the Y value, while
X is represented by the
horizontal axis. It appears
that the two diagonal lines
cross at the point where the X value is somewhere between 2
and 3, indicating that Orange Cab costs less than the other,
after 3 miles of traveling.
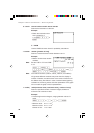
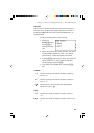
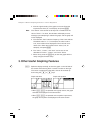
8. Next, press T to find the
values per graph increment.
When the traveling distance
is 2 miles, the Tomato Cab
charges 30 cents less overall
than the Orange Cab, but it
costs 30 cents more at 3 miles. To make the X increment
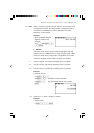
smaller, press @ y.
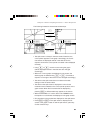
9. When the Table setting window appears, move the cursor
down to “TBLStep”, type . 5, and press E. Now
the Y values will be sampled at every 0.5 mile.
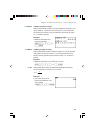
10
. Press T to show the
table again. It indicates that
when the X value is 2.5, both
Y1 and Y2 values are 6.5. It
is now clear that if you are
traveling 2.5 miles or more,
the Orange Cab costs less.
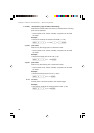
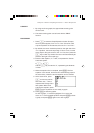
2. Explanations of Various Graphing Keys
Y: Displays the Graph Equation window. Up to 10 different equations
can be entered.
After the graph expression is entered, press E to store the
equation.