


157
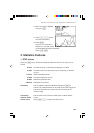
Chapter 10: Statistics & Regression Calculations
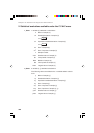
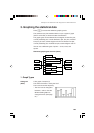
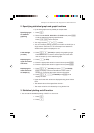
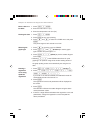
2. Specifying statistical graph and graph functions
• Up to three graphs can be plotted per sample data.
1. Press [.
2. Select from A PLOT1, B PLOT2 or C PLOT3 and press E
to set the statistical graphing specifications.
Press @ q before step #3.
•You may just press A to C to select.
•You can overlap 3 plotting graphs (from PLOT1 to PLOT3) on a
single screen. Choose on or off at the top line to determine
whether each graph is displayed or not.
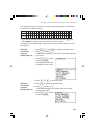
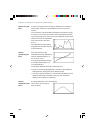
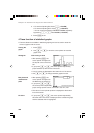
3. Press [ D (D Limit) to specify the graphing range.
The D Limit menu is used to set the upper and lower limit
lines of sample (x) of the statistical graph.
4. Press 1 (1 SET).
5. Enter the appropriate value for Lower limit and press E.
6. Enter the appropriate value for Upper limit and press E.
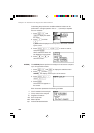
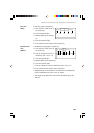
7. Press [ D (D Limit) and press 2 (2 LimON)
E to display a line that indicates the mean value of
sample (x), as well as the upper and lower limit lines.
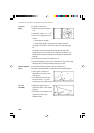
8. Press [ D 3 (3 LimOFF) and E not to
display the lines.
• Upper and lower limit values are displayed using short broken
lines.
• The default value of the upper/lower limit is 1.
* The mean value line is indicated by a long broken line.
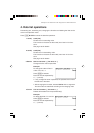
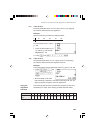
3. Statistical plotting on/off function
•You can set the statistical plotting of PLOT 1 to 3 at once.
1. Press [.
2. Press E.
Limit settings
(x value)
Displaying the
upper and lower
limit lines
Displaying the
mean value line
of sample (x)
Specifying type
of statistics
graphing