


148
Chapter 10: Statistics & Regression Calculations
15
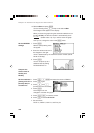
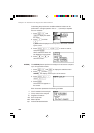
. Select 9 Stat and press E.
You can directly press 9 at step 13 to select 9 Stat.
The histogram will appear on the display.
When you draw the graph using the automatic statistics zoom
function (9 Stat), the division number is automatically set to
Xmax
–
Xmin
Xscl
(default value: 10). If you wish to show the graph
hour by hour, change the value in the W menu.
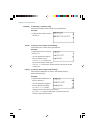
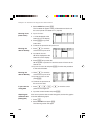
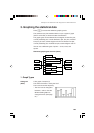
1. Press W.
Window (Rect) setting menu
will appear.
2. Enter the values as shown in
the diagram to the right.
Ymax is determined by the maximum access number (253 at
20:00 on Sunday).
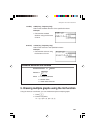
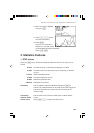
3. Press G.
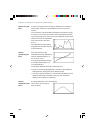
You can compare up to 3
statistical data by setting
PLOT2/PLOT3 to on.
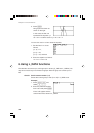
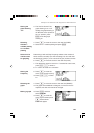
1. Press [ A E and move the cursor to GRAPH.
2. Press [ again.
3. Press B and 1
(broken line with circle dots).
4. Press G.
The histogram is now
changed to a broken line graph.
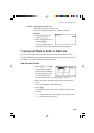
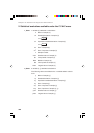
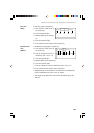
5. Press @ q to clear the screen.
6. Press [ and select B PLOT2.
7. Set as follows.
PLOT: on, DATA: X, ListX: L1, and Freq: L3.
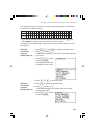
Set the WINDOW
settings
Set the statistical
plotting of PLOT1
(Sunday data) to
a broken line
Compare the
access rates on
Sunday and
Monday