


51
Chapter 4: Basic Graphing Features — Basic Keyboard
CONCEPT
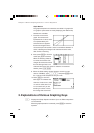
1. By using two linear graphs, the approximate crossing point
can be found.
2. The exact crossing point can be found with the TABLE
function.
PROCEDURE
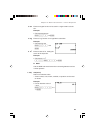
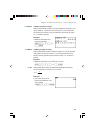
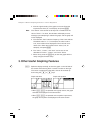
1. Press Y to enter the Graph Equation window. Six equa-
tion entry areas appear, from “Y1=” to “Y6=”. Since we need
only two equations in this exercise, let’s use “Y1=” and “Y2=”.
2. By default, the cursor should be placed on the right side of the
“Y1=” equation, next to the equal sign. If this is not so, use the
cursor keys to bring the cursor to the “Y1=” line, then press the
C key to clear any entries. The cursor will automatically be
placed to the right of the equal sign.
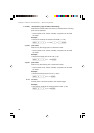
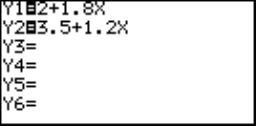
3. Enter the first equation, “2
+ 1.8X”, to represent the Tomato
Cab’s fare system.
2 + 1 . 8 x
Use the x key to enter the “x”, representing the distance
in miles.
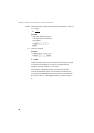
4. When the equation line is complete, press E. The first
equation is now stored, and the cursor automatically jumps to
the second line, where the second equation can be entered.
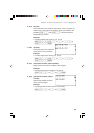
5. At the second line, press
C to clear any entries,
then enter “3.5
+ 1.2X” to
represent the Orange Cab’s
fare system. When done
entering the equation, press
E. The two equations are now ready to graph.
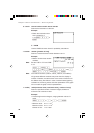
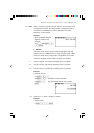
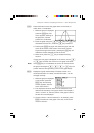
6. Press G to draw the graphs.
To draw a graph, “=” must be highlighted. If not, move the
cursor to “=” of the targeted equation and press E to draw
a graph, and press E again not to draw a graph.