


SR850 DSP Lock-In Amplifier
1-6
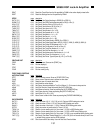
INPUTS AND OUTPUTS
Channel 1 Output X, R, θ, or Trace 1-4. Traces are defined as A•B/C or A•B/C
2
where A, B,
and C are selected from the quantities Unity, X, Y, R, θ, Xnoise, Ynoise,
Rnoise, Aux Inputs 1 through 4, or Frequency.
Output Voltage: ±10 V full scale. 10 mA max output current.
Channel 2 Output Y, R, θ, or Trace 1-4. Traces are defined as A•B/C or A•B/C
2
where A, B,
and C are selected from the quantities Unity, X, Y, R, θ, Xnoise, Ynoise,
Rnoise, Aux Inputs 1 through 4, or Frequency.
Output Voltage: ±10 V full scale. 10 mA max output current.
X and Y Outputs Rear panel outputs of cosine (X) and sine (Y) components.
Output Voltage: ±10 V. 10 mA max output current.
Aux. Outputs 4 BNC Digital to Analog outputs.
±10 V full scale, 1 mV resolution. May be set to a fixed voltage or swept in
amplitude (linear or log). 10 mA max output current.
Aux. Inputs 4 BNC Analog to Digital inputs.
Differential inputs with1 MΩ input impedance on both shield and center
conductor. ±10 V full scale, 1 mV resolution.
Trigger Input TTL trigger input triggers each data sample and/or start of scan.
Monitor Output Analog output of signal amplifiers (before the demodulator).
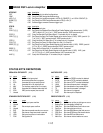
DISPLAYS
Screen Format Single or dual display.
Displayed Quantities Each display may show one of the traces.
Traces are defined as A•B/C or A•B/C
2
where A, B and C are selected from
the quantities Unity, X, Y, R, θ, Xnoise, Ynoise, Rnoise, Aux Inputs 1
through 4, or Frequency.
Display Types Large numeric readout with bar graph, polar graph, and strip chart.
Chart Data Buffer 64k data points may be stored and displayed on strip charts. The buffer can
be configured as a single trace with 64k points, 2 traces with 32k points
each, or 4 traces with16k points each. The internal data sample rate ranges
from 512 Hz down to 1 point every 16 seconds. Samples can also be
triggered.
ANALYSIS FUNCTIONS
Smoothing 5 - 25 point Savitsky-Golay smoothing of trace regions.
Curve Fits Line, Exponential, and Gaussian fits of trace regions.
Calculator Arithmetic, trigonometric, and logarithmic calculations on trace regions.
Statistics Mean and standard deviation of trace regions.
GENERAL
Monitor Monochrome CRT. 640H by 480V resolution.
Adjustable brightness and screen position.
Interfaces IEEE-488, RS232 and Printer interfaces standard.
All instrument functions can be controlled through the IEEE-488 and RS232
interfaces. A PC keyboard input is provided for additional flexibility.
Preamp Power Power connector for SR550 and SR552 preamplifiers.
Hardcopy Screen dumps to dot matrix and HP LaserJet compatible printers. Data
plots to HP-GL compatible plotters (via RS232 or IEEE-488). Screens can
also be saved to disk as PCX image files.
Disk 3.5 inch DOS compatible format, 720 kbyte capacity.
Storage of data and setups.
Power 60 Watts, 100/120/220/240 VAC, 50/60 Hz.
Dimensions 17"W x 6.25"H x 19.5"D
Weight 40 lbs.
Warranty One year parts and labor on materials and workmanship.