Chapter 4: Parametric Graphing 139
Setting Window Variables
Setting Window VariablesSetting Window Variables
Setting Window Variables
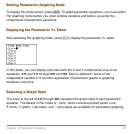
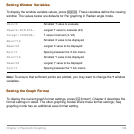
To display the window variable values, press p. These variables define the viewing
window. The values below are defaults for Par graphing in Radian angle mode.
Note: To ensure that sufficient points are plotted, you may want to change the T window
variables.
Setting the Graph Format
Setting the Graph FormatSetting the Graph Format
Setting the Graph Format
To display the current graph format settings, press y.. Chapter 3 describes the
format settings in detail. The other graphing modes share these format settings; Seq
graphing mode has an additional axes format setting.
Tmin=0
Smallest T value to evaluate
Tmax=6.2831853... Largest T value to evaluate (2p)
Tstep=.1308996... T value increment (pà24)
Xmin=L10
Smallest X value to be displayed
Xmax=10
Largest X value to be displayed
Xscl=1
Spacing between the X tick marks
Ymin=L10
Smallest Y value to be displayed
Ymax=10
Largest Y value to be displayed
Yscl=1
Spacing between the Y tick marks


