


Chapter 13: Inferential Statistics and Distributions 384
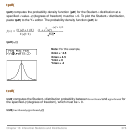
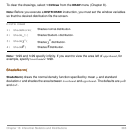
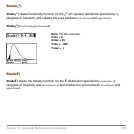
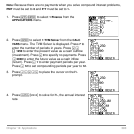
ShadeNorm(lowerbound,upperbound[,m,s])
Shade_t(
Shade_t(Shade_t(
Shade_t(
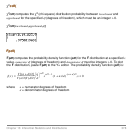
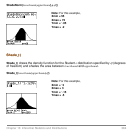
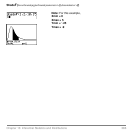
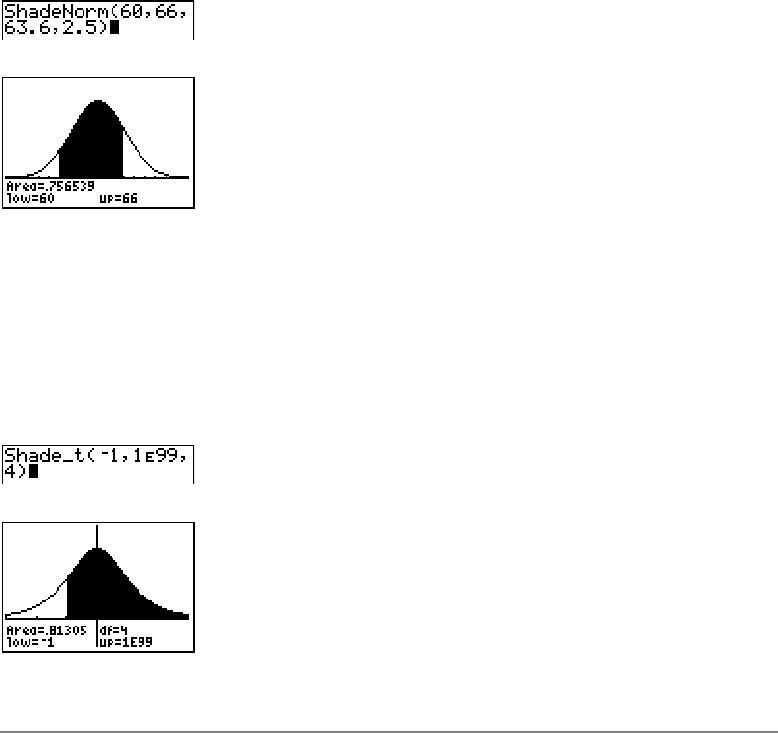
Shade_t( draws the density function for the Student-t distribution specified by df (degrees
of freedom) and shades the area between
lowerbound and upperbound.
Shade_t(lowerbound,upperbound,df)
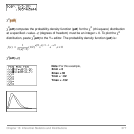
Note: For this example,
Xmin = 55
Xmax = 72
Ymin =
L.05
Ymax = .2
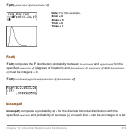
Note: For this example,
Xmin =
L3
Xmax = 3
Ymin =
L.15
Ymax = .5