Chapter 12: Statistics 319
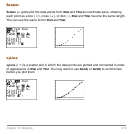
Scatter
ScatterScatter
Scatter
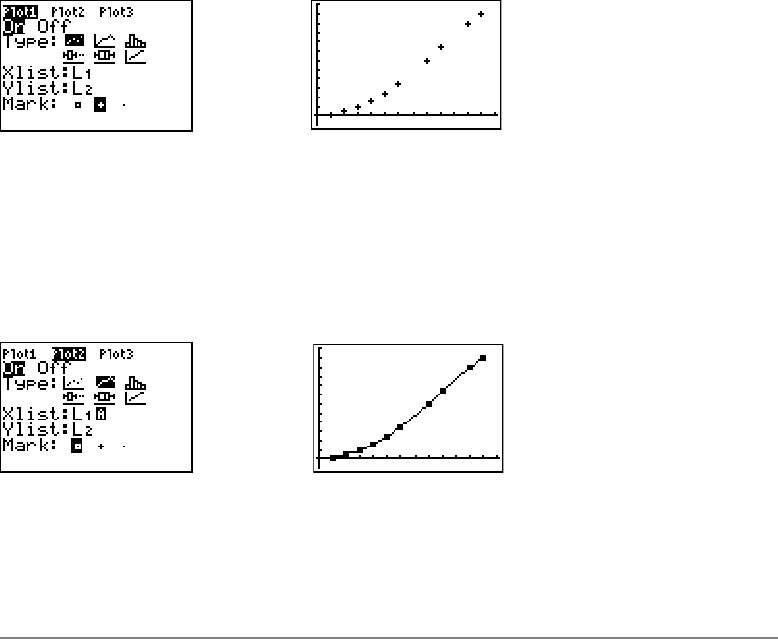
Scatter (")plots plot the data points from Xlist and Ylist as coordinate pairs, showing
each point as a box ( › ), cross (
+ ), or dot ( ¦ ). Xlist and Ylist must be the same length.
You can use the same list for
Xlist and Ylist.
xyLine
xyLinexyLine
xyLine
xyLine (Ó)is a scatter plot in which the data points are plotted and connected in order
of appearance in
Xlist and Ylist. You may want to use SortA( or SortD( to sort the lists
before you plot them.


