


Chapter 12: Statistics 320
Histogram
HistogramHistogram
Histogram
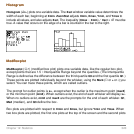
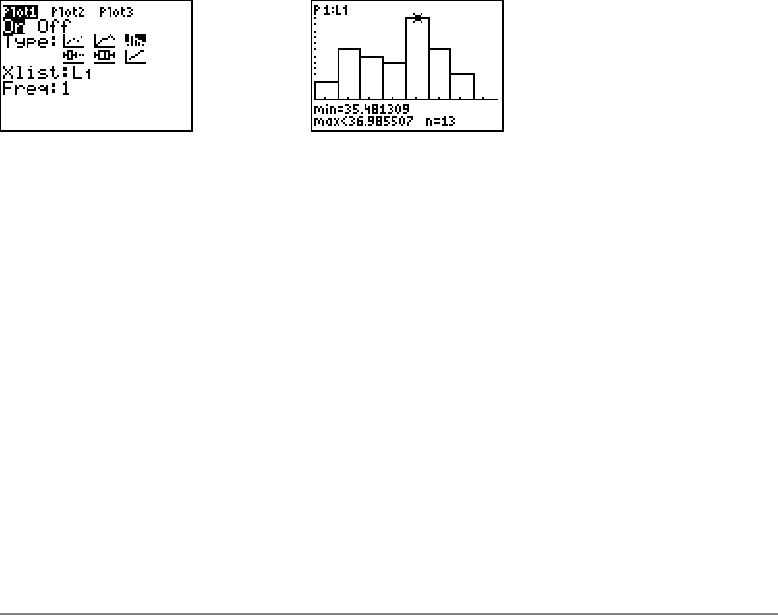
Histogram (Ò) plots one-variable data. The Xscl window variable value determines the
width of each bar, beginning at
Xmin. ZoomStat adjusts Xmin, Xmax, Ymin, and Ymax to
include all values, and also adjusts
Xscl. The inequality (Xmax N Xmin) à Xscl 47 must be
true. A value that occurs on the edge of a bar is counted in the bar to the right.
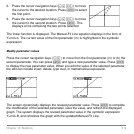
ModBoxplot
ModBoxplotModBoxplot
ModBoxplot
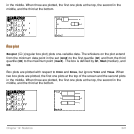
ModBoxplot (Õ) (modified box plot) plots one-variable data, like the regular box plot,
except points that are 1.5 … Interquartile Range beyond the quartiles. (The Interquartile
Range is defined as the difference between the third quartile
Q3 and the first quartile Q1.)
These points are plotted individually beyond the whisker, using the
Mark (› or + or ¦) you
select. You can trace these points, which are called outliers.
The prompt for outlier points is
x=, except when the outlier is the maximum point (maxX)
or the minimum point (
minX). When outliers exist, the end of each whisker will display x=.
When no outliers exist,
minX and maxX are the prompts for the end of each whisker. Q1,
Med (median), and Q3 define the box.
Box plots are plotted with respect to
Xmin and Xmax, but ignore Ymin and Ymax. When
two box plots are plotted, the first one plots at the top of the screen and the second plots