


Chapter 12: Statistics 322
NormProbPlot
NormProbPlotNormProbPlot
NormProbPlot
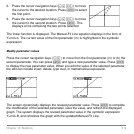
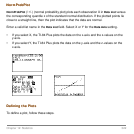
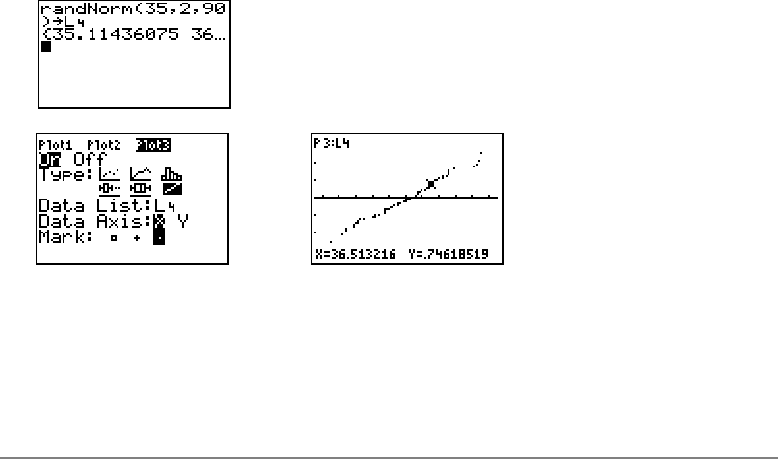
NormProbPlot (Ô) (normal probability plot) plots each observation X in Data List versus
the corresponding quantile z of the standard normal distribution. If the plotted points lie
close to a straight line, then the plot indicates that the data are normal.
Enter a valid list name in the
Data List field. Select X or Y for the Data Axis setting.
• If you select X, the TI-84 Plus plots the data on the x-axis and the z-values on the
y-axis.
• If you select Y, the TI-84 Plus plots the data on the y-axis and the z-values on the
x-axis.
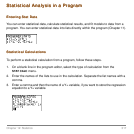
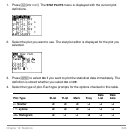
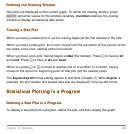
Defining the Plots
Defining the PlotsDefining the Plots
Defining the Plots
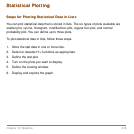
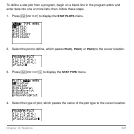
To define a plot, follow these steps.