Chapter 7: Tables 182
values also are displayed. All dependent-variable values may not be displayed if
Depend: Ask is selected.
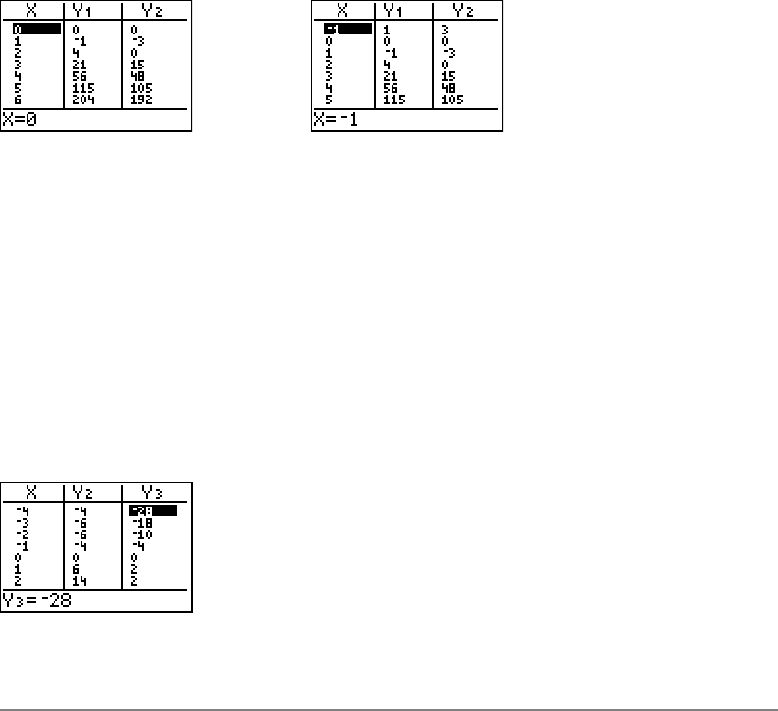
Note: You can scroll back from the value entered for TblStart. As you scroll, TblStart is
updated automatically to the value shown on the top line of the table. In the example
above,
TblStart=0 and @Tbl=1 generates and displays values of X=0, …, 6; but you can
press } to scroll back and display the table for
X=M1, …, 5.
Displaying Other Dependent Variables
Displaying Other Dependent VariablesDisplaying Other Dependent Variables
Displaying Other Dependent Variables
If you have defined more than two dependent variables, the first two selected Y=
functions are displayed initially. Press ~ or | to display dependent variables defined by
other selected Y= functions. The independent variable always remains in the left column,
except during a trace with Par graphing mode and G-T split-screen mode set.


