


Chapter 3: Function Graphing 94
Defining a Graph
Defining a GraphDefining a Graph
Defining a Graph
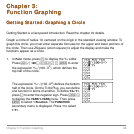
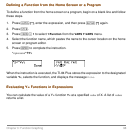
To define a graph in any graphing mode, follow these steps. Some steps are not always
necessary.
1. Press z and set the appropriate graph mode.
2. Press o and enter, edit, or select one or more functions in the Y= editor.
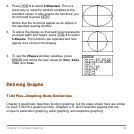
3. Deselect stat plots, if necessary.
4. Set the graph style for each function.
5. Press p and define the viewing window variables.
6. Press y . and select the graph format settings.
Displaying and Exploring a Graph
Displaying and Exploring a GraphDisplaying and Exploring a Graph
Displaying and Exploring a Graph
After you have defined a graph, press s to display it. Explore the behavior of the
function or functions using the TI-84 Plus tools described in this chapter.
Saving a Graph for Later Use
Saving a Graph for Later UseSaving a Graph for Later Use
Saving a Graph for Later Use
You can store the elements that define the current graph to any of 10 graph database
variables (
GDB1 through GDB9, and GDB0; Chapter 8). To recreate the current graph
later, simply recall the graph database to which you stored the original graph.
These types of information are stored in a
GDB.
• Y= functions
• Graph style settings