Chapter 6: Sequence Graphing 162
Displaying a Sequence Graph
Displaying a Sequence GraphDisplaying a Sequence Graph
Displaying a Sequence Graph
To plot the selected sequence functions, press s. As a graph is plotted, the TI-84
Plus updates X, Y, and
n.
Smart Graph applies to sequence graphs (Chapter 3).
Exploring Sequence Graphs
Exploring Sequence GraphsExploring Sequence Graphs
Exploring Sequence Graphs
Free-Moving Cursor
Free-Moving CursorFree-Moving Cursor
Free-Moving Cursor
The free-moving cursor in Seq graphing works the same as in Func graphing. In
RectGC
format, moving the cursor updates the values of X and Y; if
CoordOn format is selected,
X and Y are displayed. In
PolarGC format, X, Y, R, and q are updated; if CoordOn format
is selected, R and q are displayed.
TRACE
TRACETRACE
TRACE
The axes format setting affects TRACE.
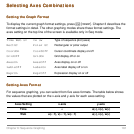
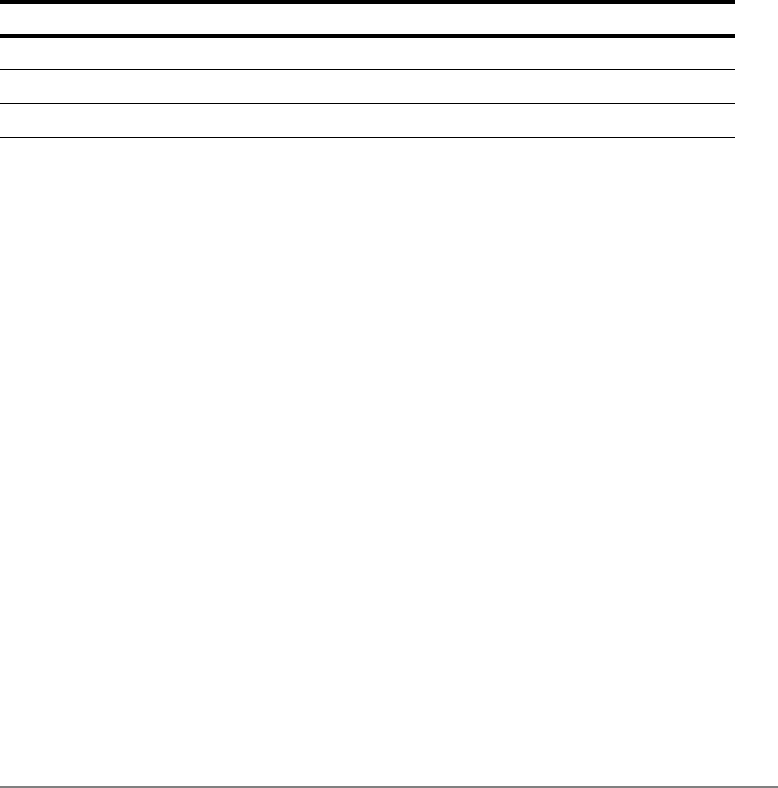
uv u(n)v(n)
vw v(n)w(n)
uw u(n)w(n)
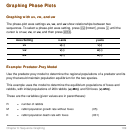
Axes Setting x-axis y-axis


