7-4
Monitoring and Analyzing Switch Operation
Web Browser Interface Status Information
Monitoring and Analyzing
Switch Operation
Web Browser Interface Status
Information
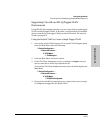
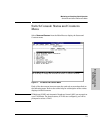
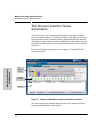
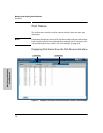
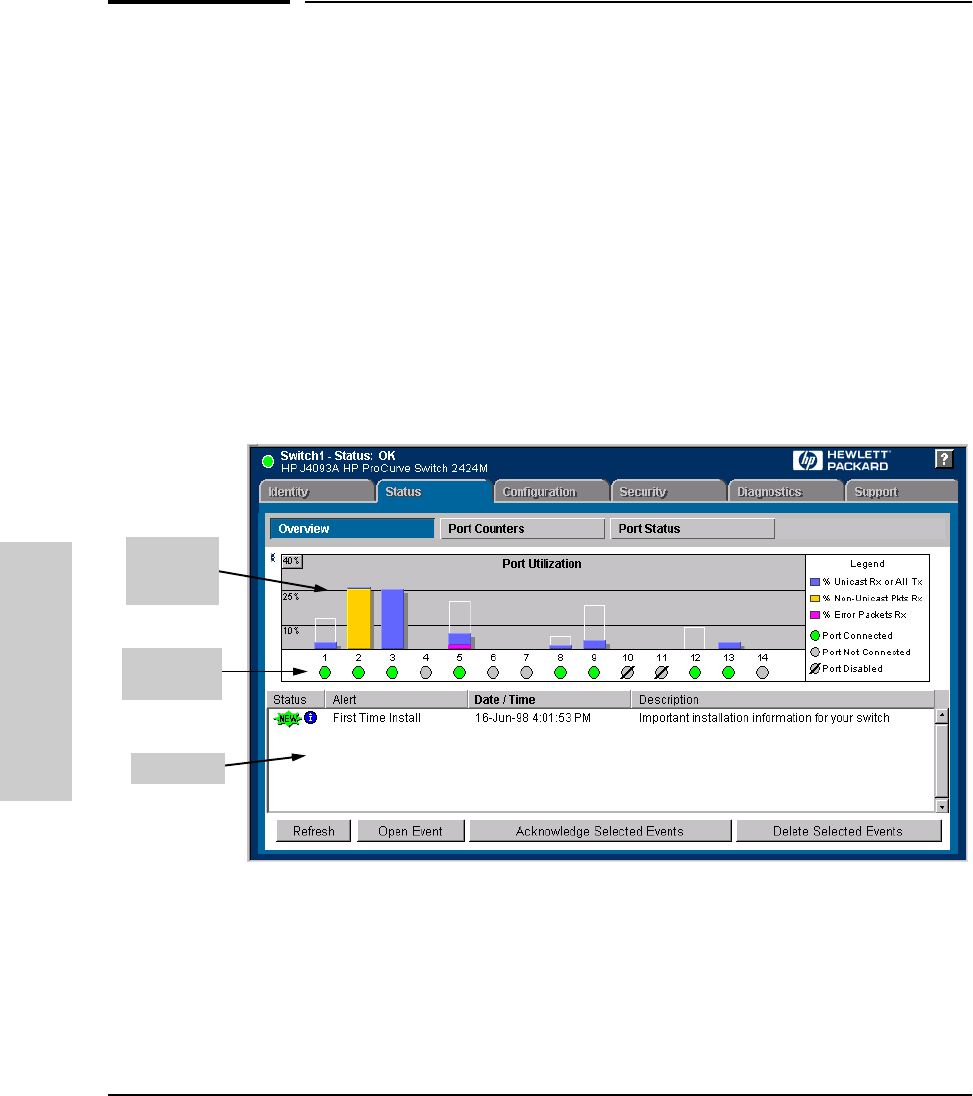
The “home” screen for the web browser interface is the Status Overview
screen, as shown in figure 7-2. As the title implies, it provides an overview of
the status of the switch, including summary graphs indicating the network
utilization on each of the switch ports, symbolic port status indicators, and
the Alert Log, which informs you of any problems that may have occurred on
the switch.
For more information on this screen, see chapter 3, “Using the HP Web
Browser Interface”.
Figure 7-2. Example of a Web Browser Interface Status Overview Screen
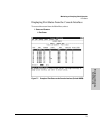
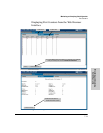
The other web browser interface status screens, Port Counters, and Port
Status are described later in this chapter.
Alert Log
Port Status
Indicators
Port
Utilization
Graphs


