4–5Graphics
• The
maximum number of data bytes in the
DA
T
A portion of the program statement (when
using 132–column paper) varies according to the operating mode:
At 60 dpi, Single Density = 792 bytes;
Double Density = 1584 bytes
Quadruple Density = 3168 bytes
• Data
in excess of the right mar
gin is discarded. If the auto line feed is enabled, data in excess
of the right margin causes a Line Feed (LF) and continue printing on the next line.
A
detailed description of the individual Bit Image control codes with examples is provided in the Pro
-
gramming chapter.
Bit Image Sample Program
The
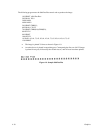
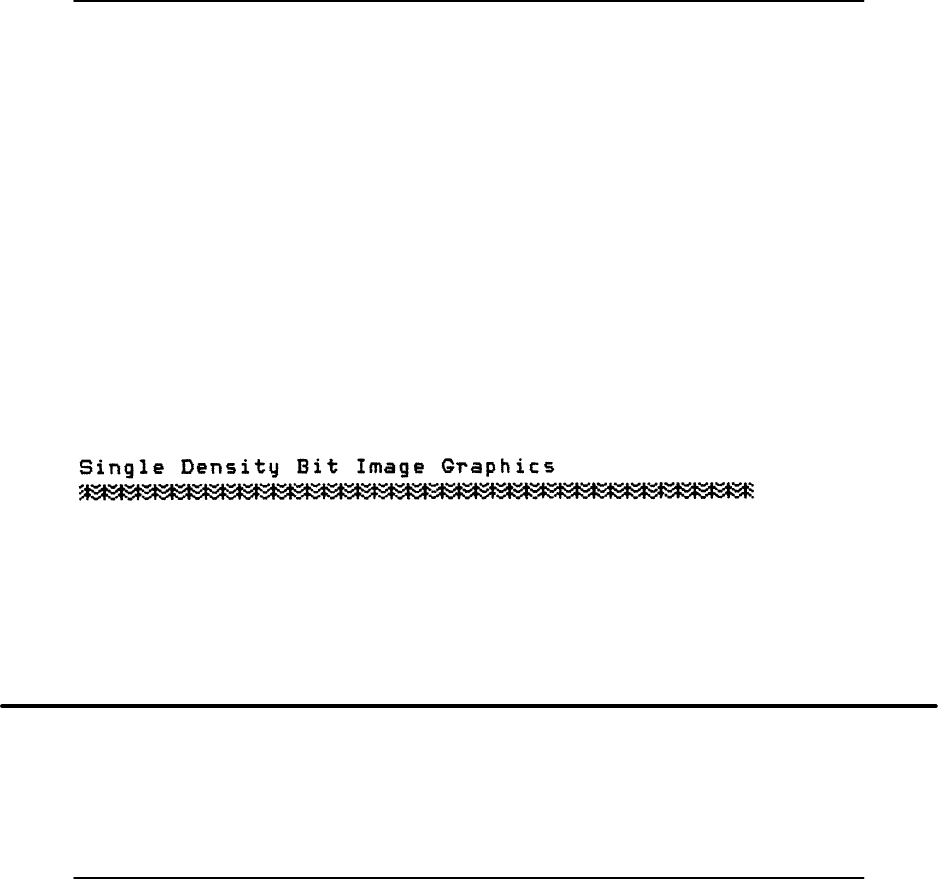
following sample program written in BASIC produces Single Density Bit Image graphics of the
pattern
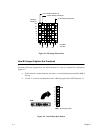
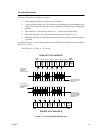
shown in Figure 4–1. The 7 data
bit pattern is repeated 40 times. The printed result of running
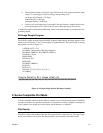
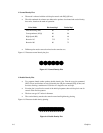
the program is shown in Figure 4–4.
5 WIDTH “LPT1:”,255
10 LPRINT “
Single Density Bit Image Graphics
”
20 LPRINT CHR$(27);“K”;CHR$(24);CHR$(1);
30 FOR N=1 TO 40
40 RESTORE
50 FOR I=1 TO 7
60 READ R
70 LPRINT CHR$(R);
80 NEXT I
90 NEXT N
100 DATA 73, 146, 36, 255, 36, 146, 73
110 LPRINT
Figure 4–4. Sample Single Density Bit Image Graphics
P–Series Compatible Plot Mode
P–Series
compatible odd/even dot
Plot Mode is available only in P–Series printer protocol. Plot Mode
can
address and print any individual dot position. This produces a variety of graphics, including bar
codes, complex curve graphs, pie and bar charts, block characters, or halftones.
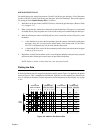
Plot Density
Plot
density refers to the number of dots per inch (dpi) printed in a single dot row
. T
wo types of plot
density are available with P–Series Plot Mode graphics: normal density and double density.


