


Using Features for Advanced Applications
3–200
TDS 500C, TDS 600B, & TDS 700C User Manual
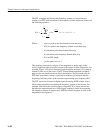
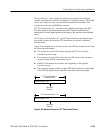
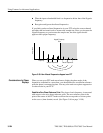
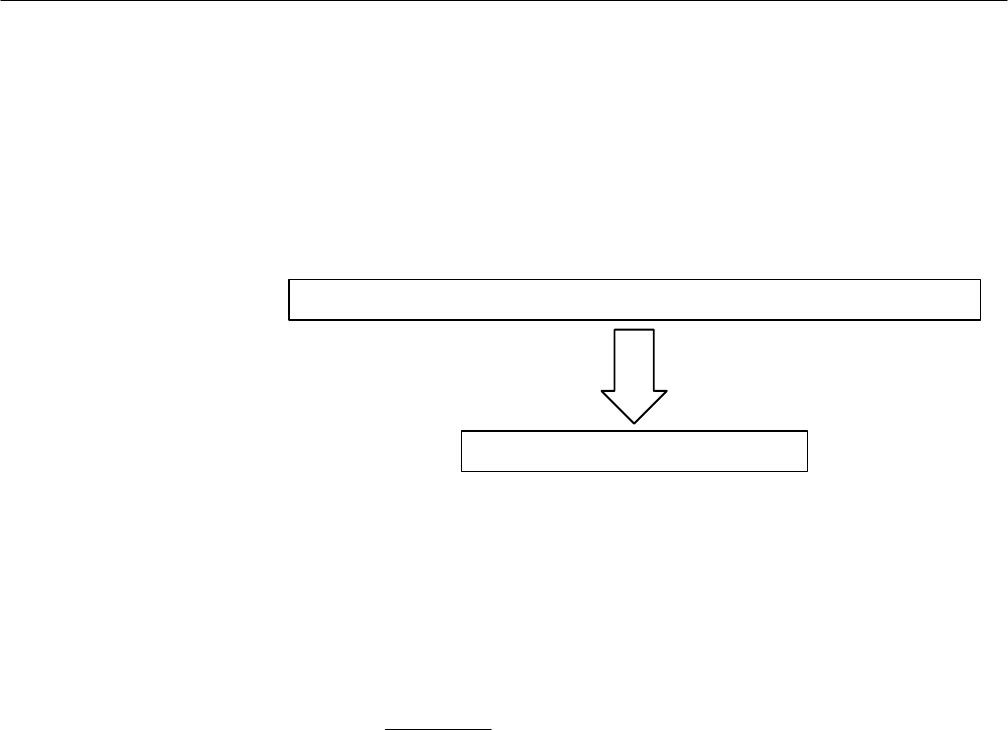
FFTs Transform Time Records to Frequency Records. The FFT time domain
record just described is input for the FFT. Figure 3–97 shows the transformation
of that time domain data record into an FFT frequency domain record. The
resulting frequency domain record is one half the length of the FFT input
because the FFT computes both positive and negative frequencies. Since the
negative values mirror the positive values, only the positive values are displayed.
FFT Time Domain Record
FFT Frequency Domain Record
FFT
Figure 3–97: FFT Time Domain Record vs. FFT Frequency Domain Record
FFT Frequency Range and Resolution. When you turn on an FFT waveform, the
oscilloscope displays either the magnitude or phase angle of the FFT frequency
domain record. The resolution between the discrete frequencies displayed in this
waveform is determined by the following equation:
DF +
Sample Rate
FFT Length
Where: DF is the frequency resolution.
Sample Rate is the sample rate of the source waveform.
FFT Length is the length of the FFT Time Domain waveform
record.
The sample rate also determines the range these frequencies span; they span from
0 to
1
@
2
the sample rate of the waveform record. (The value of
1
@
2
the sample rate is
often referred to as the Nyquist frequency or point.) For example, a sample rate
of 20 Megasamples per second would yield an FFT with a range of 0 to 10 MHz.
The sample rates available for acquiring data records vary over a range. TDS
oscilloscopes display the sample rate in the acquisition readout at the top of the
oscilloscope screen.