Appendix B: Algorithms
B–10
TDS 500C, TDS 600B, & TDS 700C User Manual
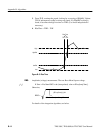
0% (lowest) voltage reference value calculated. (See High, Low on page B–1.)
Using the min-max measurement technique:
Low = Min
Amplitude (voltage) measurement. The maximum voltage. Typically the most
positive peak voltage.
Examine all Waveform[ ] samples from Start to End inclusive, and set Max
equal to the greatest magnitude Waveform[ ] value found.
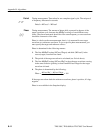
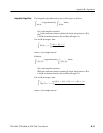
The arithmetic mean for one waveform. Remember that one waveform is not
necessarily equal to one cycle. For cyclical data you may prefer to use the cycle
mean rather than the arithmetic mean.
If Start = End then return the (interpolated) value at Start.
Otherwise,
Mean=
ŕ
End
Start
Waveform(t)dt
(End * Start) SampleInterval
For details of the integration algorithm, see page B–15.
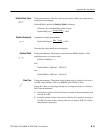
The normalized mean. If the waveform source is from an optical probe, this can
give average optical power.
Mean dBm = 10.0(log
10
(Mean / 0.001))
Amplitude (voltage) measurement. The minimum amplitude. Typically the most
negative peak voltage.
Examine all Waveform[ ] samples from Start to End inclusive, and set Min
equal to the smallest magnitude Waveform[ ] value found.
Low
Maximum
Mean
Mean dBm
Minimum


