_____________________________________________________________________
B096-016 B096-048 and B092-016 User Manual Page 129
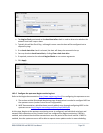
Click Apply
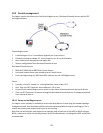
Now set the Console Server to send alerts to the Nagios server
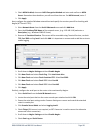
Select Alerts from the Alerts & Logging menu and click Add Alert
In Description enter: Administrator connection
Check Nagios (NSCA)
In Applicable Ports check the serial port that has the router console port attached. In Applicable
Hosts check the IP address/DNS name of the IIS server
Click Connection Alert
Click Apply
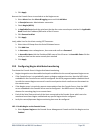
Lastly, add a User for the client running SDT Connector:
Select Users & Groups from the Serial & Network menu
Click Add User
In Username, enter: sdtnagiosuser, then enter and confirm a Password
In Accessible Hosts click the IP address/DNS name of the IIS server. In Accessible Ports click the
serial port that has the router console port attached
Click Apply
10.3 Configuring Nagios distributed monitoring
To activate the Console Server’s Nagios distributed monitoring:
Nagios integration must be enabled and a path established to the central/upstream Nagios server
If the Console Server is to periodically report on Nagios-monitored services, then the NSCA client
embedded in the Console Server must be configured: the NSCA program enables scheduled check-
ins with the remote Nagios server and is used to send passive check results across the network to
the remote server
If the Nagios server is to actively request status updates from the Console Server, then the NRPE
server embedded in the Console Server must be configured – the NRPE server is the Nagios
daemon for executing plug-ins on remote hosts
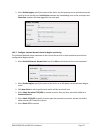
Each of the Serial Ports and each of the Hosts connected to the Console Server which are to be
monitored must have Nagios enabled and any specific Nagios checks configured
Lastly the central/upstream Nagios monitoring host must be configured
10.3.1 Enable Nagios on the Console Server
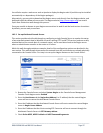
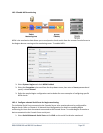
Select System: Nagios on the Console Server Management Console and tick the Nagios service
Enabled


