5-4
I V-Window Memory
You can store up to six sets of V-Window settings in V-Window memory for recall when you
need them.
S To store V-Window settings
1. From the Main Menu, enter the GRAPH mode.
2. Press (V-WIN) to display the V-Window setting screen, and input the values you
want.
3. Press (STO) to display the pop-up window.
4. Press a number key to specify the V-Window memory where you want to save the settings,
and then press U. Pressing @U stores the settings in V-Window Memory 1 (V-Win1).
S To recall V-Window memory settings
1. From the Main Menu, enter the GRAPH mode.
2. Press (V-WIN) to display the V-Window setting screen.
3. Press (RCL) to display the pop-up window.
4. Press a number key to specify the V-Window memory number for the settings you want to
recall, and then press U. Pressing @U recalls the settings in V-Window Memory 1
(V-Win1).
I Specifying the Graph Range
You can define a range (start point, end point) for a function before graphing it.
1. From the Main Menu, enter the GRAPH mode.
2. Make V-Window settings.
3. Specify the function type and input the function. The following is the syntax for function
input.
Function ( [ ) Start Point End Point ( ] )
4. Draw the graph.
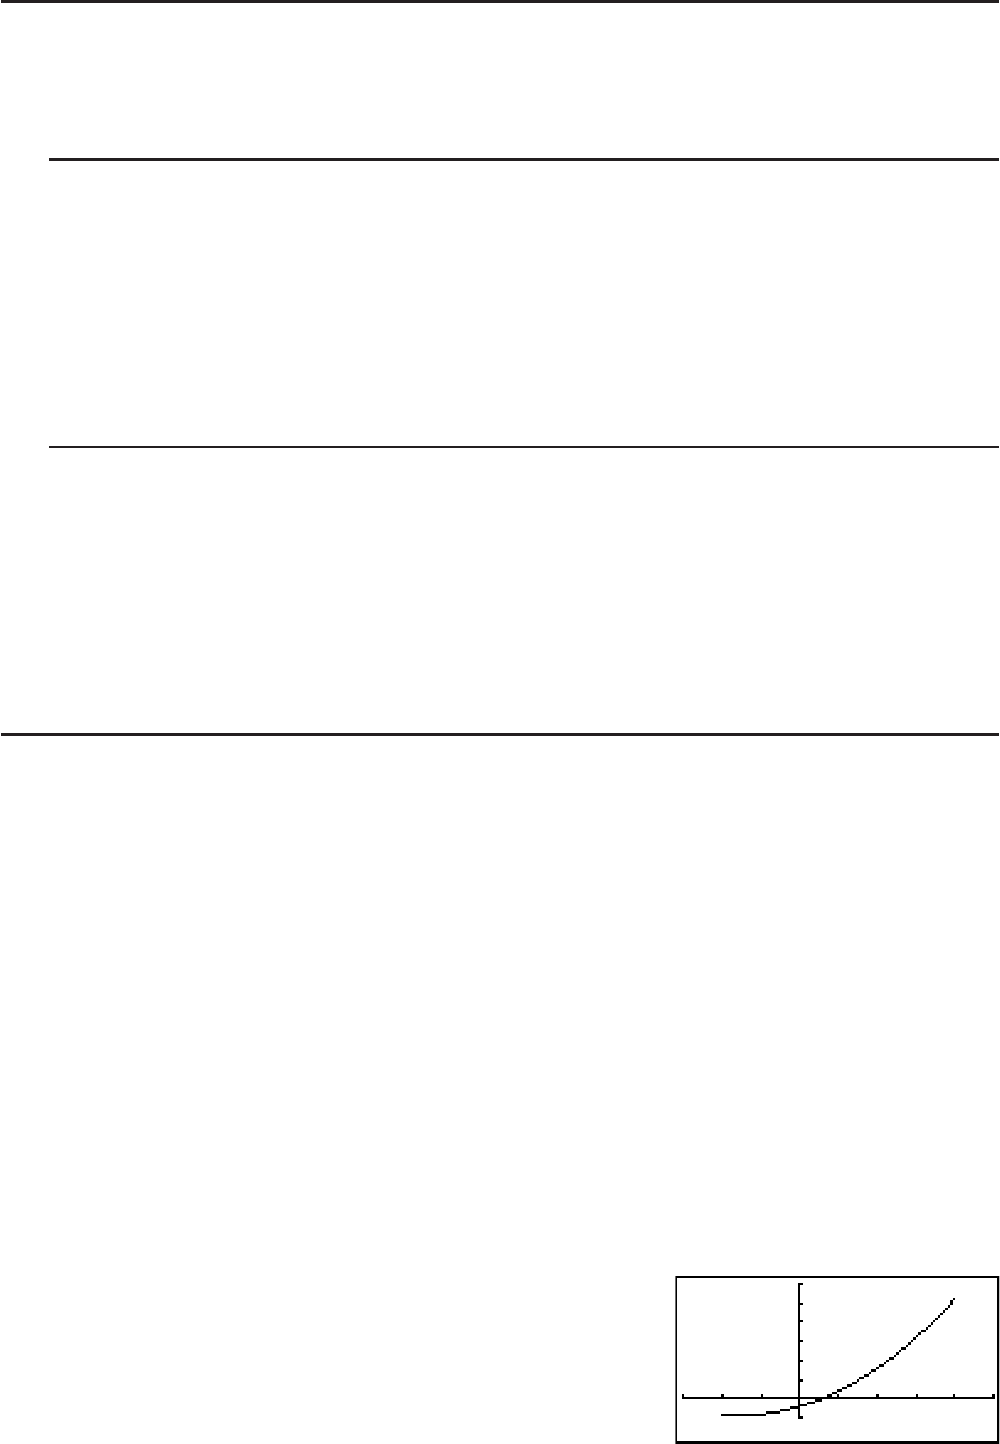
Example Graph
y = x
2
+ 3x – 2 within the range – 2 x 4.
Use the following V-Window settings.
Xmin = –3, Xmax = 5, Xscale = 1
Ymin = –10, Ymax = 30, Yscale = 5
K GRAPH
(V-WIN)BUDU@UA
@?UB?UDU)
(TYPE)(Y=)TVBTA
( [ )AC( ] )U
(DRAW)
• You can specify a range when graphing rectangular expressions, polar expressions,
parametric functions, and inequalities.


