6-7
• Press (DRAW) to return to the original single-variable statistical graph.
• When Mod has multiple solutions, they are all displayed.
• You can use the Setup screen’s “Q1Q3 Type” setting to select either “Std” (standard
calculation) or “OnData” (French calculation) for the Q1 and Q3 calculation mode.
For details about calculation methods while “Std” or “OnData” is selected, see “Calculation
Methods for the Std and OnData Settings” below.
I Calculation Methods for the Std and OnData Settings
Q1 and Q3 can be calculated in accordance with the Setup screen’s “Q1Q3 Type” setting as
described below.
S Std
With this calculation method, processing depends on whether the number of elements n in the
population is an even number or odd number.
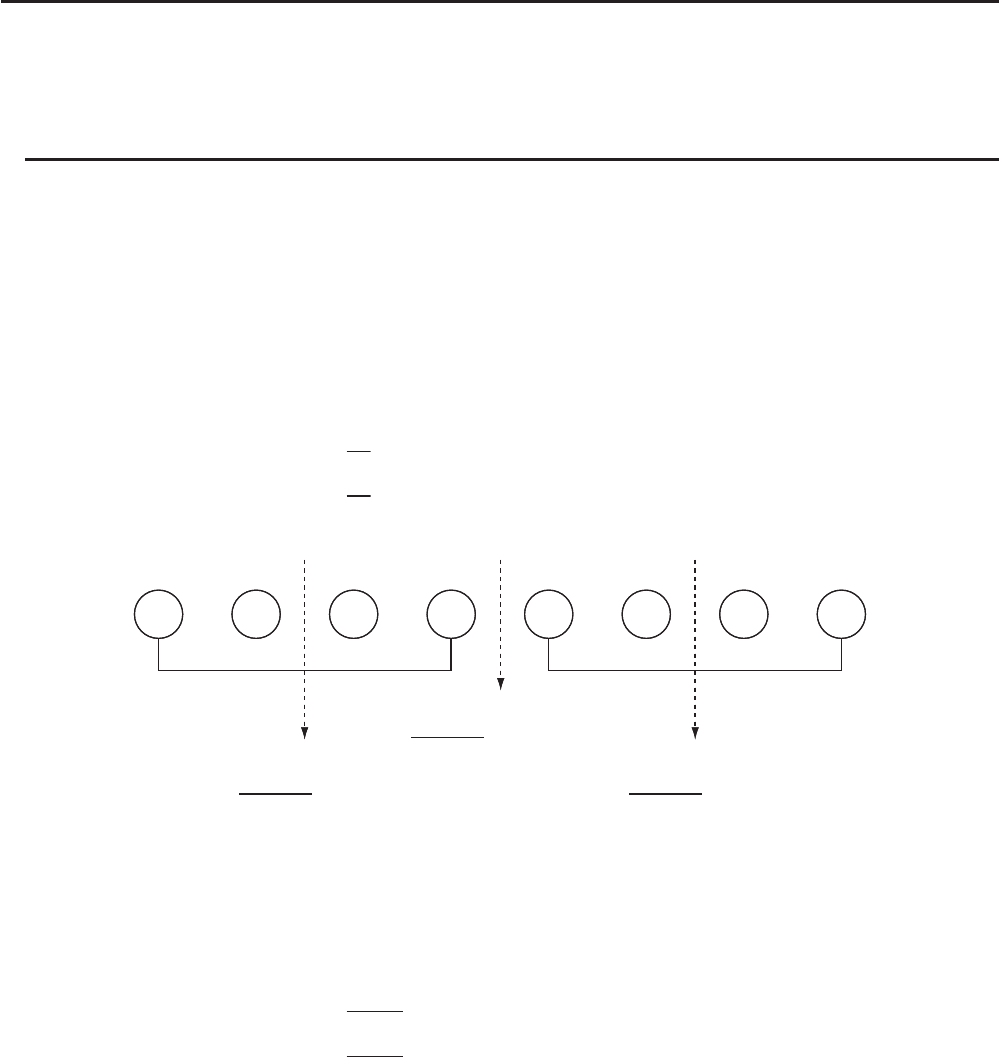
When the number of elements
n is an even number:
Using the center point of the total population as the reference, the population elements are
divided into two groups: a lower half group and an upper half group. Q1 and Q3 then become
the values described below.
Q1 = {median of the group of
2
n
items from the bottom of the population}
Q3 = {median of the group of
2
n
items from the top of the population}
Center Point Center Point Center Point
When the number of elements
n is an odd number:
Using the median of the total population as the reference, the population elements are divided
into two groups: a lower half group (values less than the median) and an upper half group
(values greater than the median). The median value is excluded. Q1 and Q3 then become the
values described below.
Q1 = {median of the group of
2
n
– 1
items from the bottom of the population}
Q3 = {median of the group of
2
n
– 1
items from the top of the population}
• When
n = 1, Q1 = Q3 = population center point.
2
4
+
5
=
Median
= Q1
2
2
+
3
= Q3
2
6
+
7
12345678
2
4
+
5
=
Median
= Q1
2
2
+
3
= Q3
2
6
+
7
12345678


