


6-19
I Normal Probability Distribution Calculation
You can calculate normal probability distributions for single-variable statistics with the
RUN•MAT (or RUN) mode.
Press *(E)(PROB) ((PROB) on the fx-7400G
II) (E) to display a function
menu, which contains the following items.
•{P(}/{Q(}/{R(} ... obtains normal probability {P(
t)}/{Q(t)}/{R(t)} value
•{
t(} ... {obtains normalized variate t(x) value}
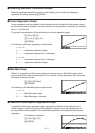
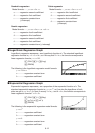
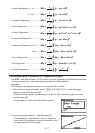
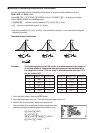
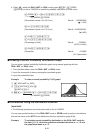
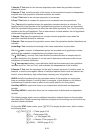
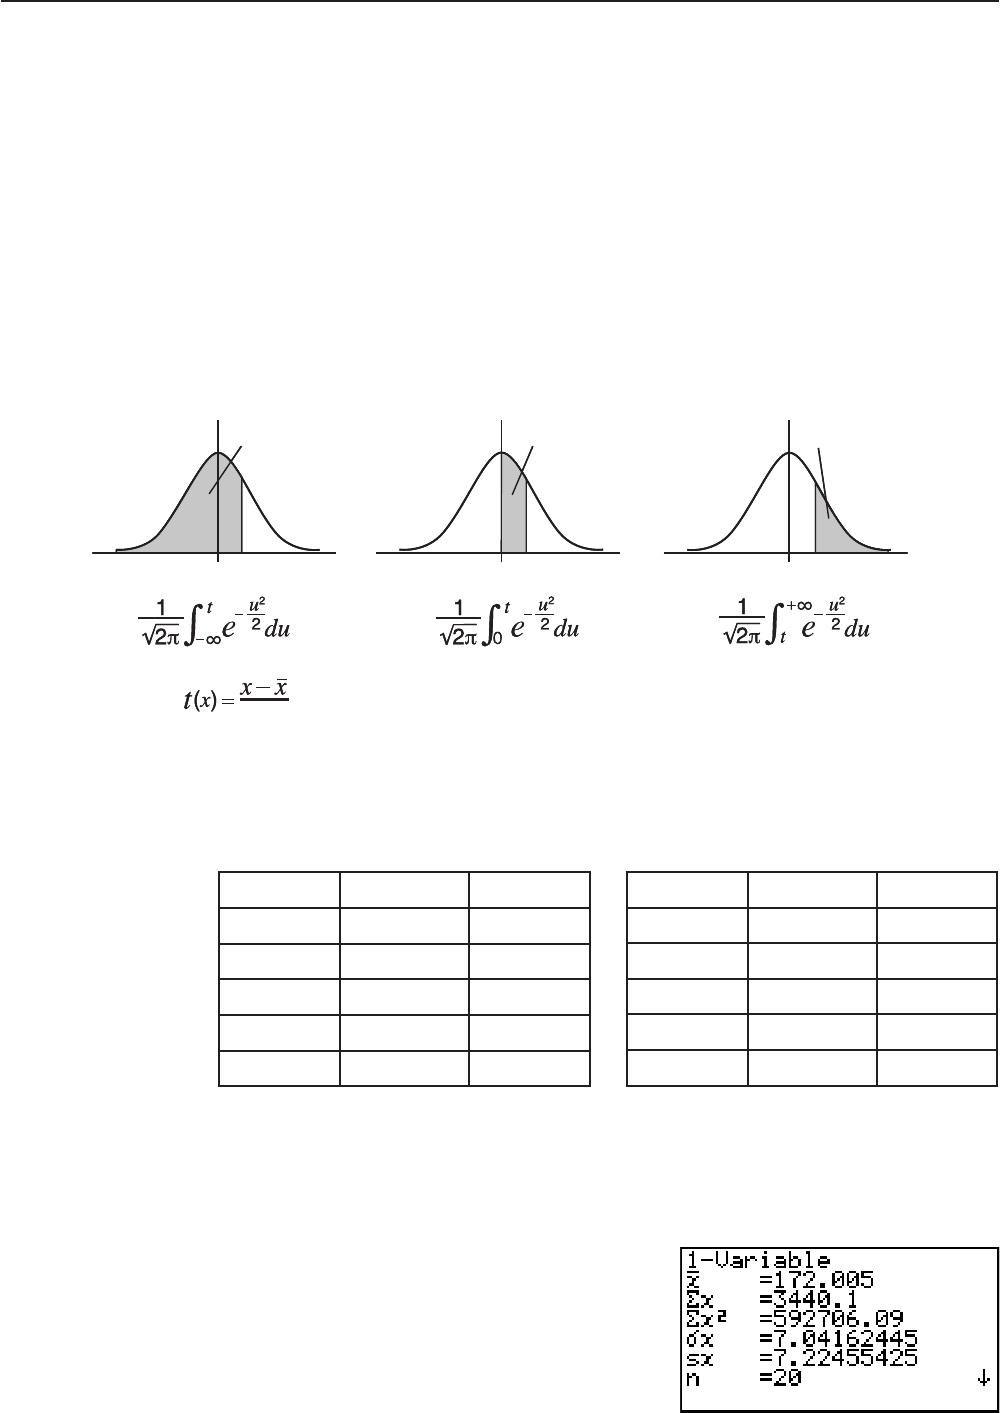
• Normal probability P(
t), Q(t), and R(t), and normalized variate t(x) are calculated using the
following formulas.
Standard Normal Distribution
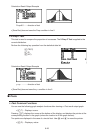
Example The following table shows the results of measurements of the height of
20 college students. Determine what percentage of the students fall in
the range 160.5 cm to 175.5 cm. Also, in what percentile does the 175.5
cm tall student fall?
Class no. Height (cm) Frequency
1 158.5 1
2 160.5 1
3 163.3 2
4 167.5 2
5 170.2 3
P(
t
)Q(
t
)R(
t
)
tt t
00 0
x
P(
t
)Q(
t
)R(
t
)
tt t
00 0
x
Class no. Height (cm) Frequency
6 173.3 4
7 175.5 2
8 178.6 2
9 180.4 2
10 186.7 1
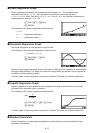
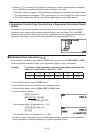
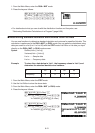
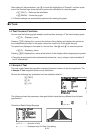
1. From the Main Menu, enter the STAT mode.
2. Input the height data into List 1 and the frequency data into List 2.
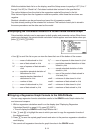
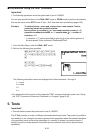
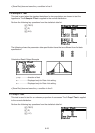
3. Perform the single-variable statistical calculations.
You can obtain the normalized variate immediately after
performing single-variable statistical calculations only.
(CALC)(SET)
(LIST)@U
A(LIST)AU)(QUIT)
(CALC)(1VAR)