5-14
(TYPE)(Y=)?T(A)TVB
( [ )?T(A)(=)B@@
( ] )U
(DRAW)
• The value of only one of the variables in the expression can change.
• Any of the following cannot be used for the variable name: X, Y, r,
Q
, T.
• You cannot assign a variable to the variable inside the function.
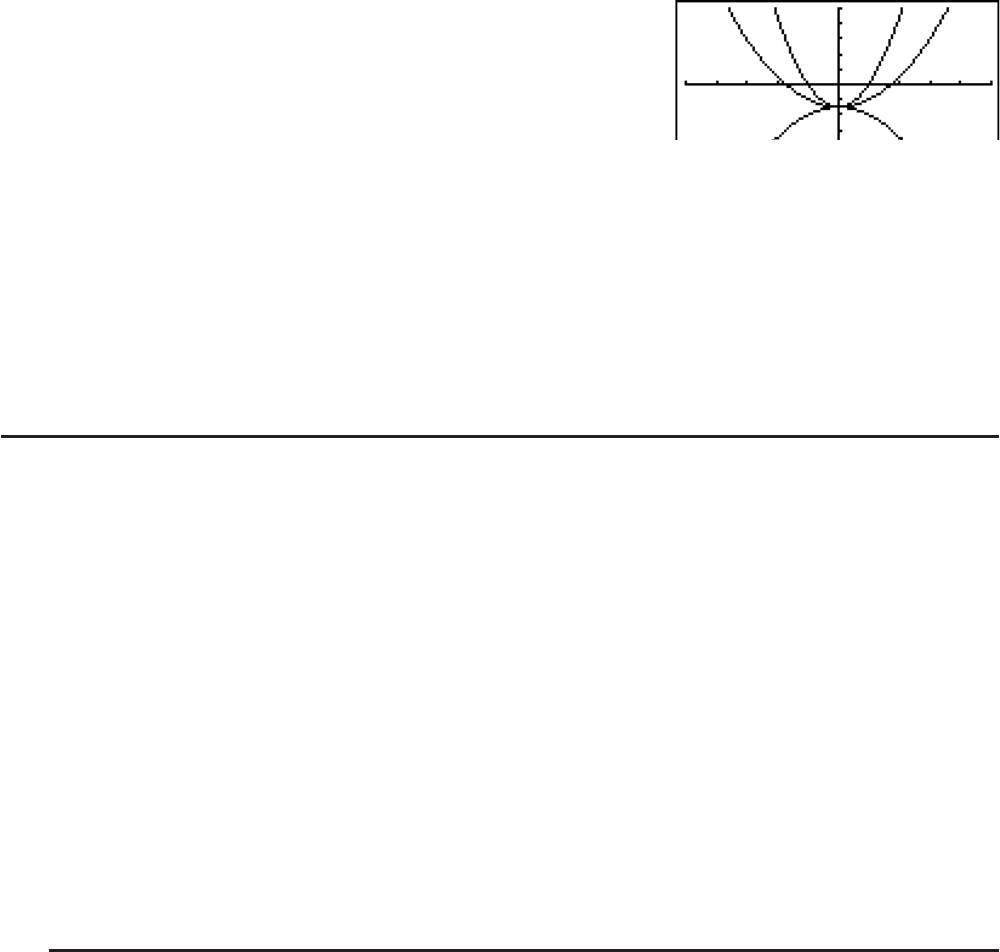
• When Simul Graph is turned on, all of the graphs for the specified variable values are drawnWhen Simul Graph is turned on, all of the graphs for the specified variable values are drawn
simultaneously.
• Overwrite can be used when graphing rectangular expressions, polar expressions,
parametric functions, and inequalities.
I Using Copy and Paste to Graph a Function
You can graph a function by copying it to the clipboard, and then pasting it into the graph
screen.
There are two types of functions you can paste into the graph screen.
Type 1 (Y= expression)
A function with the Y variable to the left of the equal sign is graphed as Y=
expression.
Example: To paste Y=X and graph it
• Any spaces to the left of Y are ignored.
Type 2 (expression)
Pasting this type of expression graphs Y= expression.
Example: To paste X and graph Y=X
• Any spaces to the left of the expression are ignored.
S To graph a function using copy and paste
1. Copy the function you want to graph to the clipboard.
2. From the Main Menu, enter the GRAPH mode.
3. On the Setup screen, change the “Dual Screen” setting to “Off”.
4. Make V-Window settings.
5. Draw the graph.
6. Paste the expression.
Example While the graph of
y = 2x
2
+ 3x – 4 is currently displayed, to paste the
previously copied function Y=X from the clipboard
Use the following V-Window settings.
Xmin = –5, Xmax = 5, Xscale = 2
Ymin = –10, Ymax = 10, Yscale = 5
