5-16
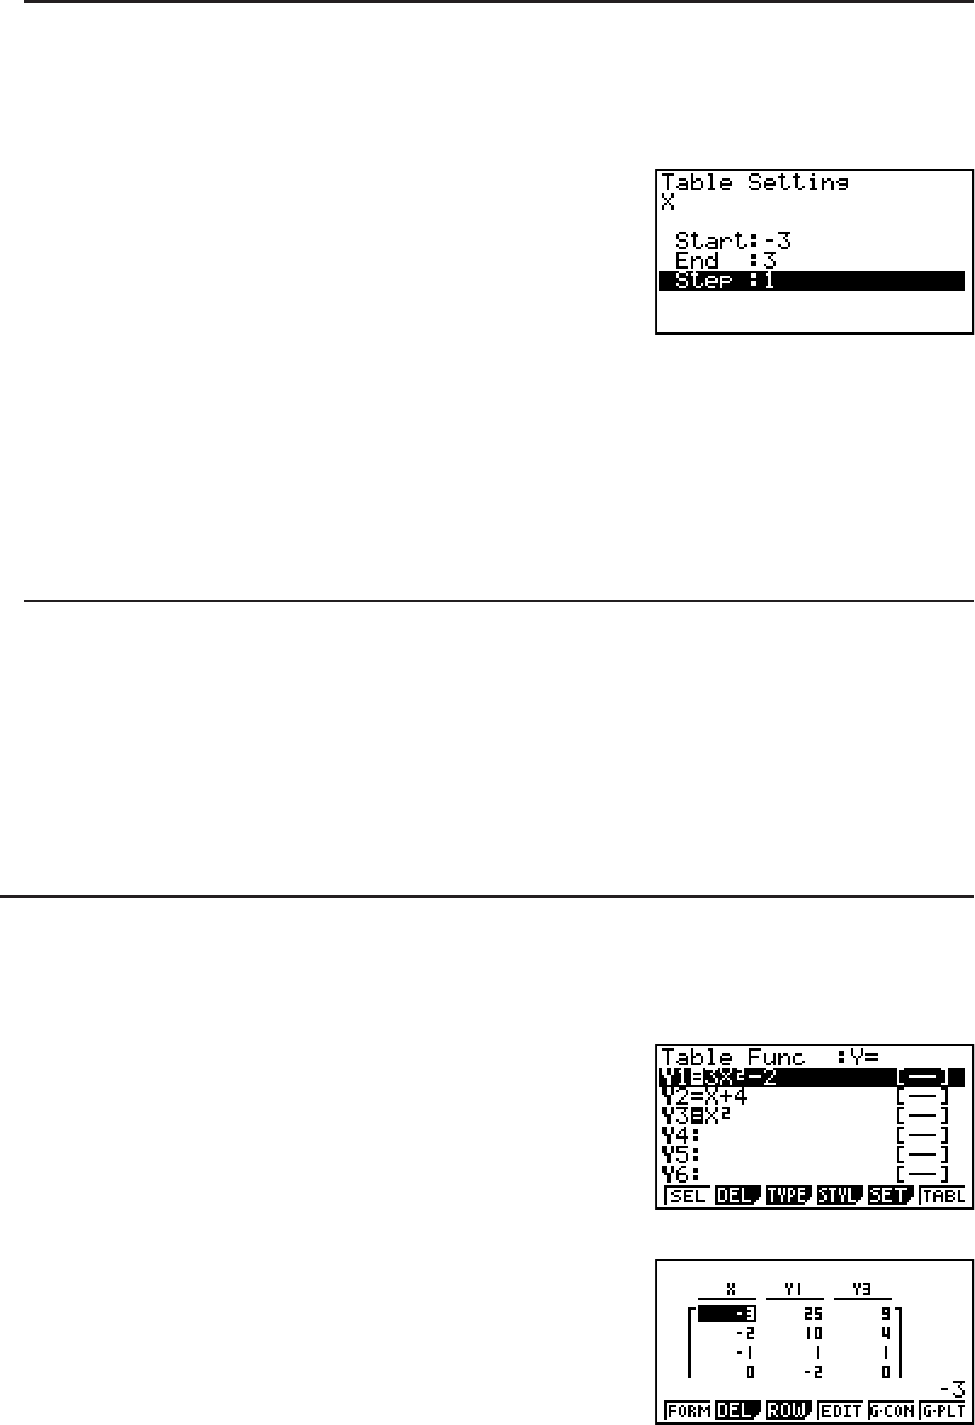
S To generate a table using a table range
Example To generate a table as the value of variable x changes from –3 to 3, in
increments of 1
K TABLE
(SET)
BUBU@U
The numeric table range defines the conditions under which the value of variable
x changes
during function calculation.
Start ............ Variable
x start value
End ............. Variable
x end value
Step ............ Variable
x value change (interval)
After specifying the table range, press ) to return to the Table relation list.
S To generate a table using a list
1. While the Table relation list is on the screen, display the Setup screen.
2. Highlight Variable and then press (LIST) to display the pop-up window.
3. Select the list whose values you want to assign for the
x-variable.
• To select List 6, for example, press EU. This causes the setting of the Variable
item of the Setup screen to change to List 6.
4. After specifying the list you want to use, press ) to return to the previous screen.
S Generating a Table
Example To generate a table of values for the functions stored in memory areas
Y1 and Y3 of the Table relation list
Use D and A to move the highlighting to the
function you want to select for table generation and
press (SEL) to select it.
The “=” sign of selected functions is highlighted on
the screen. To deselect a function, move the cursor
to it and press (SEL) again.
Press (TABL) to generate a number table using
the functions you selected. The value of variable
x
changes according to the range or the contents
of the list you specified.
The example screen shown here shows the results based
on the contents of List 6 (–3, –2, –1, 0, 1, 2, 3).
Each cell can contain up to six digits, including negative sign.


