


5-9
3. Press (Yes) to delete the function or (No) to abort the procedure without deleting
anything.
• Using the above procedure to delete one line of a parametric function (such as Xt2) also
will delete the applicable paired line (Yt2, in the case of Xt2).
I Selecting Functions for Graphing
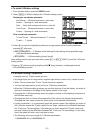
S To specify the draw/non-draw status of a graph
1. On the Graph relation list, use D and A to highlight the relation you do not want to graph.
2. Press (SEL).
• Each press of (SEL) toggles graphing on and off.
3. Press (DRAW).
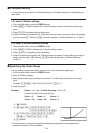
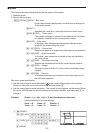
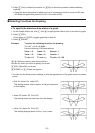
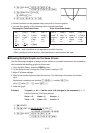
Example To select the following functions for drawing:
Y1 = 2
x
2
– 5, r2 = 5 sin3
Q
Use the following V-Window settings.
Xmin = –5, Xmax = 5, Xscale = 1
Ymin = –5, Ymax = 5, Yscale = 1
T
Q
min = 0, T
Q
max =
P
,T
Q
ptch = 2
P
/ 60
AD (Select a memory area that contains a
function for which you want to specify non-draw.)
(SEL) (Specifies non-draw.)
(DRAW) or U (Draws the graphs.)
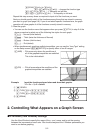
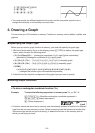
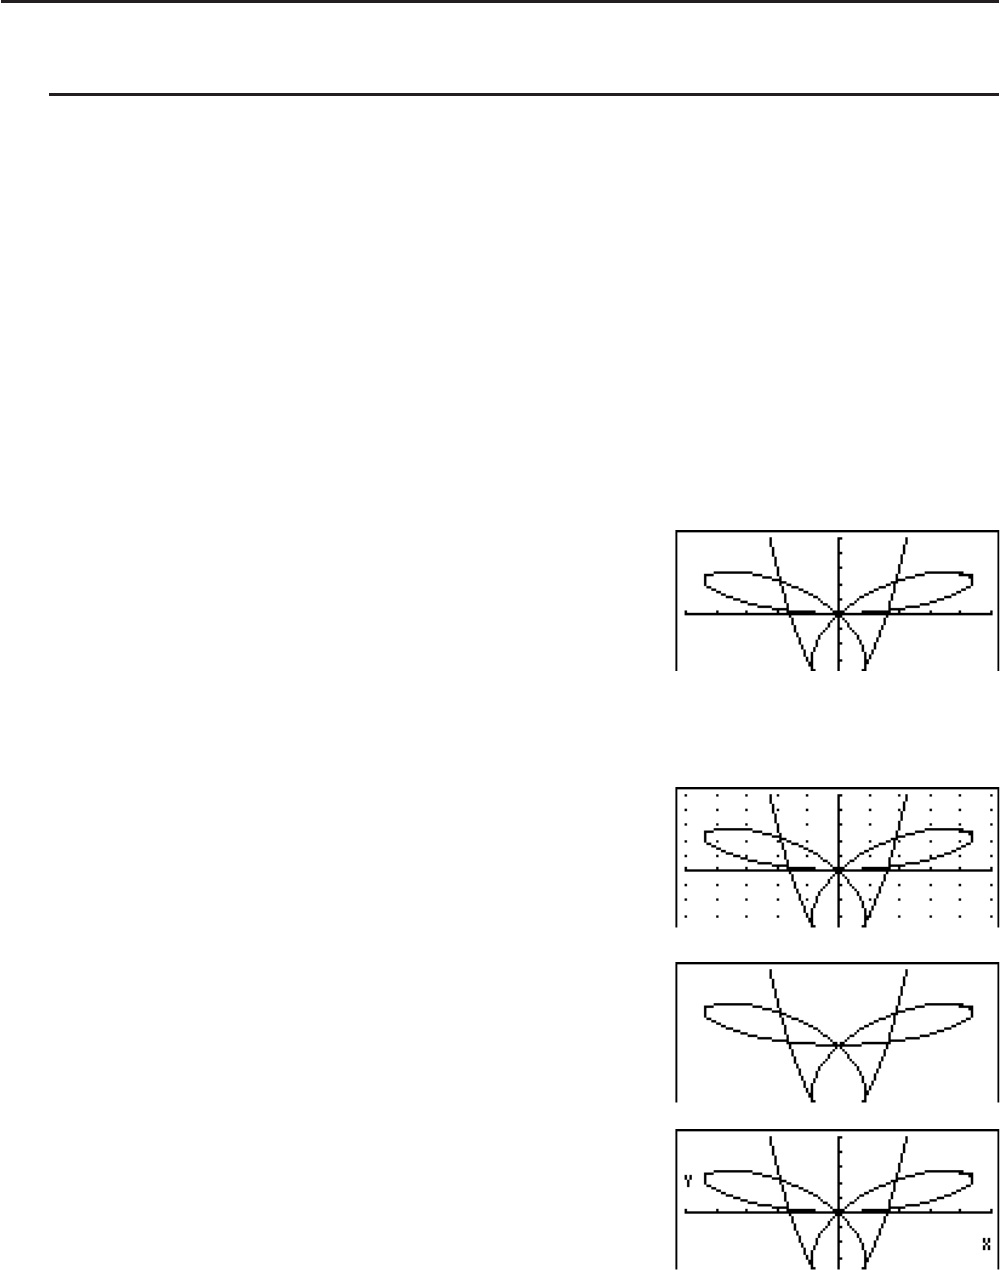
• You can use the Setup screen settings to alter the appearance of the graph screen as shown
below.
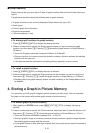
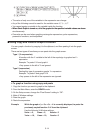
• Grid: On (Axes: On Label: Off)
This setting causes dots to appear at the grid intersects
on the display.
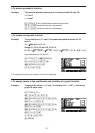
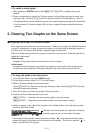
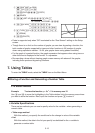
• Axes: Off (Label: Off Grid: Off)
This setting clears the axis lines from the display.
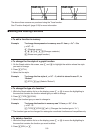
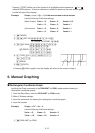
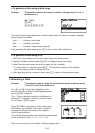
• Label: On (Axes: On Grid: Off)
This setting displays labels for the
x- and y-axes.