


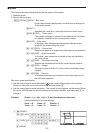
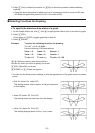
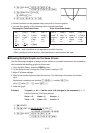
5-13
(V-WIN)DUDUAUA
@?U@?UDU)
(SKTCH)(Cls)U
(GRPH)(Y=)
ATVBTCU
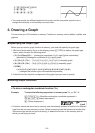
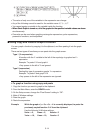
• Certain functions can be graphed easily using built-in function graphs.
• You can draw graphs of the following built-in scientific functions.
Rectangular Coordinate Graph Polar Coordinate Graph
• sin x • cos x • tan x • sin
–1
x
• cos
–1
x • tan
–1
x • sinh x • cosh x
• tanh x • sinh
–1
x • cosh
–1
x • tanh
–1
x
• x • x
2
• log x • lnx
•10
x
• e
x
• x
–1
•
3
x
•••
• sin
Q
• cos
Q
• tan
Q
• sin
–1
Q
• cos
–1
Q
• tan
–1
Q
• sinh
Q
• cosh
Q
• tanh
Q
• sinh
–1
Q
• cosh
–1
Q
• tanh
–1
Q
•
Q
•
Q
2
• log
Q
• ln
Q
•10
Q
• e
Q
•
Q
–1
•
3
Q
- Input for x and
Q
variables is not required for a built-in function.
- When inputting a built-in function, other operators or values cannot be input.
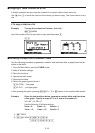
I Drawing Multiple Graphs on the Same Screen
Use the following procedure to assign various values to a variable contained in an expression
and overwrite the resulting graphs on the screen.
1. From the Main Menu, enter the GRAPH mode.
2. On the Setup screen, change the “Dual Screen” setting to “Off”.
3. Make V-Window settings.
4. Specify the function type and input the function. The following is the syntax for function
input.
Expression containing one variable ( [ ) variable (=)
value value ... value ( ] )
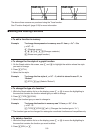
5. Draw the graph.
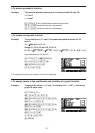
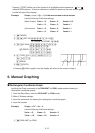
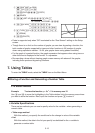
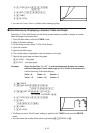
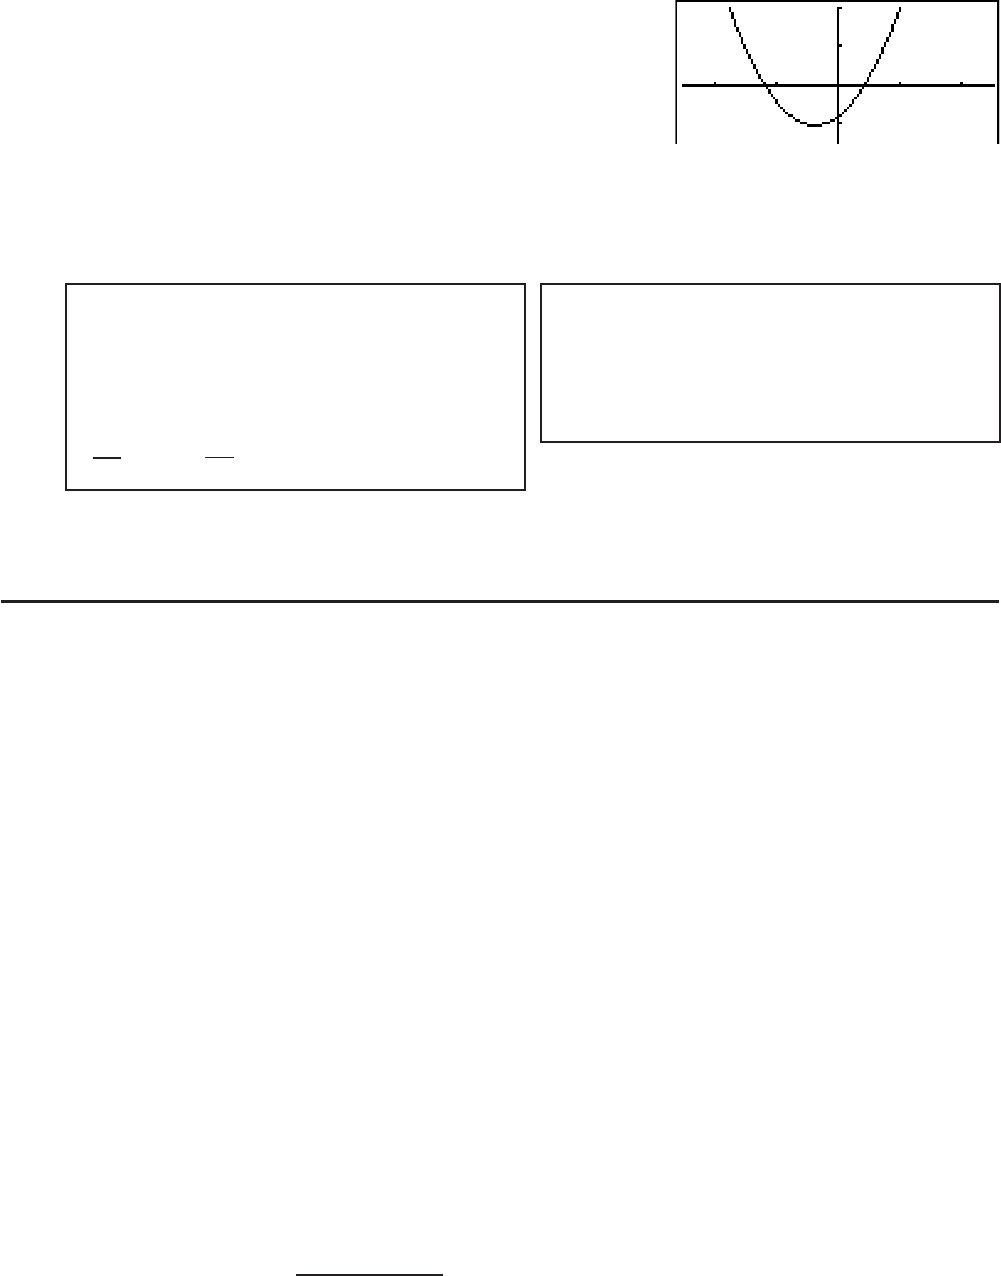
Example To graph y = A
x
2
– 3 as the value of A changes in the sequence 3, 1, –1
Use the following V-Window settings.
Xmin = –5, Xmax = 5, Xscale = 1
Ymin = –10, Ymax = 10, Yscale = 2
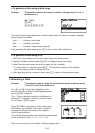
K GRAPH
K(SET UP)_AAAA*(Off))
*fx-7400G
ɉ, fx-9750Gɉ: AAA
(V-WIN)DUDU@UA
@?U@?UAU)
dx
(
x
)
d
dx
(
x
)
d
dx
2
(
x
)
d
2
dx
2
(
x
)
d
2
x
dx
x
dx